Microsoft Office Skills and Learning Guide
Microsoft Office Training Classes
Posted on 4/21/2023 by Jonathan O'Brien
- What are essential Microsoft Office skills?
- How can you learn these Microsoft Office skills?
Microsoft Office skills are essential for a successful career in the modern workplace. With its popular suite of programs, such as Word, Excel, PowerPoint, and Outlook, Microsoft Office is used by professionals across all industries to create high-quality documents, manage data efficiently and effectively present information. Mastering these tools allows employees to communicate with colleagues more easily, organize and analyze data better, and produce professional-looking presentations. Microsoft Office skills can also help increase productivity by automating mundane tasks with macros or other specialized functions.
In today’s competitive job market, having a thorough understanding of Microsoft Office can make all the difference in getting hired or promoted. It can also open up possibilities for further career advancement by allowing professionals to specialize in specific Microsoft Office applications. Employees with a comprehensive knowledge of Microsoft Office possess highly sought-after skills that can help them stand out from the crowd and succeed in their field. By taking advantage of the many resources available online or through on-site training sessions, anyone can develop their Microsoft Office skills to improve their prospects in the workplace.
Top Microsoft Office Skills to Learn
Find below a comprehensive list of essential Microsoft Office skills to learn to successfully use the program to its full capability. Find out how you can learn each skill in Certstaffix Training's courses.
Microsoft Access Basic Skills

Having strong Microsoft Access skills can help individuals and businesses in many ways. Access is a powerful database software program that allows users to store, organize, view, analyze, and share data quickly and easily. These skills are essential for people working in the corporate world as they allow them to track business-related information such as customer contacts, inventory items, and employee records. Access also enables users to create reports and forms for data entry, giving them the ability to quickly input information into their database. With Microsoft Access skills, individuals can easily maintain databases of customer contact details or sales figures. This allows them to track customer behavior patterns as well as analyze trends in sales performance over time. Access can also be used to create queries that allow users to search for specific information in their database, saving them time and effort when finding the data they need.
Learn the skills below in our Access - Level 1 or Microsoft Access Combo courses:
Microsoft Access database
A Microsoft Access database is a computer application used to store and manipulate data. It is a part of the Microsoft Office suite of applications, which also includes Word, Excel, PowerPoint, and Outlook. Access is designed to work with data stored in other applications, such as Microsoft SQL Server or Oracle Database.
Access databases are often used to store data for small businesses or organizations. They can be used to track customer information, inventory, employee records, and more. Access databases can be created using the Access software application or by exporting data from another application, such as Excel.
Access databases are typically stored on a computer's hard drive, but they can also be stored on a network drive or on a removable storage device, such as a USB flash drive. When storing an Access database on a network drive or removable storage device, it is important to ensure that the file is properly backed up in case of data loss.
Tables in Microsoft Access
Tables are a database component in Microsoft Access that stores information in a structured format. Tables are the basis for all data stored in an Access database. All data in an Access database is stored in tables.
Tables consist of rows and columns, with each row representing a record, and each column representing a field. Fields can contain various types of data, such as text, numbers, or dates. Tables can be related to each other through relationships, which are used to link data from multiple tables together.
Microsoft Access queries
Microsoft Access queries are a powerful way to retrieve and manipulate data from your database. Queries can be used to find specific records, calculate summaries, or even create new tables and forms. With the right query, you can make working with your data much easier and more efficient.
Creating a query is simple: just specify the criteria you want to use and Access will do the rest. For example, you can use a query to find all the orders placed by a particular customer, or all the products in a certain category. You can even use queries to generate custom reports.
There are two main types of queries: Select and Action. Select queries are used to retrieve data from your database, while Action queries can be used to add, change, or delete data.
Microsoft Access forms
Microsoft Access forms are an essential part of the application. They provide a user-friendly way to enter, view, and edit data. Forms can also be used to create custom reports and queries.
When creating a form, you can choose from a variety of form templates, or you can create a custom form. Forms can be created in Layout view or Design view.
Layout view is a drag-and-drop interface that lets you quickly create a form. Design view gives you more control over the form's design, and is better suited for complex forms.
Once a form has been created, it can be customized to match your specific needs. For example, you can add or remove fields, change the layout of the form, and add graphics or other objects.
Forms are an essential part of Microsoft Access and can be used to make your application more user-friendly and efficient.
Microsoft Access reports
Microsoft Access reports are a great way to collect and present data. Reports can be used to show data in tabular, summary, or detail form. They can also be used to create charts and graphs. Reports can be printed or exported to other file formats.
Creating a report is easy with Microsoft Access. Simply select the fields you want to include in the report, and then choose a layout. Access will automatically generate the report. You can then print or export the report as needed.
Microsoft Access Intermediate Skills
Intermediate Microsoft Access skills can be a great asset for any business. Having knowledge of this powerful software allows professionals to develop and maintain databases, analyze data more efficiently, and create dynamic reports. With these skills, businesses can streamline their operations by easily tracking customer information, sales figures, employee records, inventory levels, financial documents, and much more. By being able to create and modify complex queries, professionals can gather accurate insights from data and use them to inform decisions. Ultimately, having intermediate Microsoft Access skills can help businesses increase their productivity while also improving their decision-making abilities. As a result, these skills are highly sought after in many organizations today.
Learn the skills below in our Access - Level 2 or Microsoft Access Combo courses:
Database quality input
One of the most important aspects of any database is the quality of the input. Database quality input refers to the cleanliness, accuracy, and completeness of the data that is entered into a database. Poor quality input can lead to a number of problems, including inaccurate results, inconsistency in reports, and incorrect data analysis.
There are a number of ways to ensure high quality input. First, it is important to have clear and concise rules for data entry. Any ambiguity in the rules can lead to errors. Second, it is important to have a system in place to check for errors. This can be done manually or through the use of software tools. Third, it is important to have a system in place to track changes to the data. This helps to ensure that any errors can be corrected and that the database is always up-to-date.
By following these tips, you can help to ensure that your database has high quality input and avoid many of the problems that can occur with poor quality data.
Improve efficiency and data integrity in a database
There are a number of ways to improve efficiency and data integrity in a database. One way is to use a normalized database design. This means that the data is organized into tables and columns in such a way that redundancy is minimized and data dependencies are clearly defined. Another way to improve efficiency and data integrity is to use proper indexing. Indexing allows for quick retrieval of data from a database. Finally, using proper security measures can help to ensure that data is not compromised.
Improve table usability in Microsoft Access
There are a few simple ways to improve table usability in Microsoft Access. One way is to use the AutoFormat feature. This can be found under the Format menu. Another way is to use the Datasheet View options. These can be found under the View menu. Finally, you can use the Table Design options. These can also be found under the View menu. By using these features, you can improve the usability of your tables in Microsoft Access.
If you want to further improve table usability in Microsoft Access, consider using some of the following tips:
- Use field names that are easy to understand and describe the data they contain.
- Use clear and concise data entry forms.
- Use consistent field sizes and formats.
- Use meaningful table and field names.
- Avoid using abbreviations.
By following these tips, you can further improve the usability of your tables in Microsoft Access.
Microsoft Access advanced queries
Microsoft Access offers a robust and versatile platform for creating powerful queries. Advanced queries in Microsoft Access can be used to find specific information or groups of data, and can be customized to return the results you need.
There are four main types of advanced queries in Microsoft Access: crosstab queries, make-table queries, append queries, and update queries.
Crosstab queries are used to summarize data from multiple records into a single table. This can be useful for finding trends or patterns in your data.
Make-table queries are used to create new tables from existing data. This can be useful for creating backups of your data or for creating new tables with specific information that you want to analyze further.
Append queries are used to add records from one table to another. This can be useful for consolidating data from multiple tables into a single table.
Update queries are used to modify existing data in a table. This can be useful for correcting errors in your data or for updating information in multiple records at once.
Advanced queries in Microsoft Access can be created using the Query Wizard or by creating a query in SQL view.
Form formatting in Microsoft Acces
Form formatting in Microsoft Access is the process of creating a visually appealing and easy-to-use form. By taking advantage of the various tools available, you can create forms that are both aesthetically pleasing and functional.
There are a few things to keep in mind when Formatting Forms:
Layout: The layout of your form is important to consider. You want to make sure that your form is easy to read and navigate. One way to achieve this is to use a grid layout. This will ensure that your form elements are evenly spaced and easy to find.
Colors: The use of color can also be helpful in creating an appealing form. Choose colors that are complementary to each other and easy on the eyes.
Text: The text on your form should be legible and easy to read. Consider using a sans serif font such as Arial or Helvetica.
Images: If you plan on using images on your form, make sure that they are high quality and relevant to the content of your form.
These are just a few tips to keep in mind when formatting your Microsoft Access forms. By taking the time to format your forms correctly, you can create a more professional and user-friendly experience for your users.
Microsoft Access advanced reports
Microsoft Access offers a variety of advanced reports that can be used to further analyze your data. These reports can be used to identify trends, spot errors, and track progress over time.
Some of the most popular advanced reports in Microsoft Access include:
-Pivot Tables: Pivot tables are a powerful way to summarize data and identify trends. They can be used to track progress over time, compare different groups of data, and more.
-Charts and Graphs: Charts and graphs are a visual way to represent data. They can be used to spot trends, compare different groups of data, and more.
-Conditional Formatting: Conditional formatting allows you to highlight certain data points based on conditions that you set. This can be used to identify errors, track progress over time, and more.
-Macros: Macros are a way to automate repetitive tasks in Access. They can be used to populate reports with data, run queries, and more.
Microsoft Access Advanced Skills
Advanced Microsoft Access skills can be of great importance when it comes to data management and organization. With the help of MS Access, users can easily store, access, edit, and report data quickly and efficiently. Having advanced MS Access skills allows users to create complex databases for their organizations with ease, as well as being able to develop complicated forms and queries that can help make data analysis simpler. These skills also enable users to create reports, which are essential for summarizing data and making informed decisions based on the results. Advanced MS Access skills allow users to automate tasks and streamline processes that would otherwise be extremely time-consuming when done manually. By having these skills in hand, organizations can run more smoothly, allowing them to stay competitive and succeed in the current market.
Learn the skills below in our Access - Level 3 or Microsoft Access Combo courses:
Import and export data in Microsoft Access
In order to import or export data in Microsoft Access, you will need to use the Import/Export Wizard. This can be accessed by going to File > Import/Export.
From here, you will be able to choose what type of data you want to import or export. You can also specify the source and destination of the data.
Once you have chosen the options that you want, click Finish to complete the process.
Macros in Microsoft Access
Macros in Microsoft Access are a powerful tool that can automate almost any action or series of actions.
There are two types of macros - those that are attached to an object, and those that are standalone. Object-bound macros run when the object is clicked, while standalone macros can be run from anywhere within the Access database.
Macros can be used to automate just about any task in Access, from opening forms and reports to running queries and importing data. By utilizing the macro design grid, users can specify exactly what actions they want the macro to perform, and in what order.
Creating macros is a straightforward process, and even complex actions can be easily specified using the macro design grid. However, it is important to remember that macros can be a security risk, as they can potentially allow malicious code to be executed on a user's machine. For this reason, it is always best to only use trusted macros from reliable sources.
VBA in Microsoft Access
VBA, or Visual Basic for Applications, is a programming language that allows you to create custom solutions in Microsoft Access. With VBA, you can create forms, queries, and reports that are not available using the standard tools in Access. You can also automate tasks in Access using VBA.
VBA is similar to other programming languages, such as Visual Basic, but it is specifically designed for use with Microsoft Office applications. If you are familiar with other programming languages, you should be able to pick up VBA quickly.
Microsoft Excel Basic Skills

Having basic Excel skills can be highly beneficial for many businesses, as it allows employees to process and organize data quickly. With Excel, you can create detailed data tables, workbooks, and graphs that allow you to analyze and interpret information. Excel also allows for the creation of formulas, macros, and other automated processes that can help streamline workflow. By mastering basic Excel skills, employees can more effectively use the program to track progress, manage projects, and generate more accurate analytics.
Learn the skills below in our Excel - Level 1 or Excel - Combo (Levels 1-3) courses:
Excel Workbooks
An Excel Workbook is a collection of related data and information stored as one single file. It contains worksheets, which are composed of cells organized into rows and columns that can hold text, numbers, or formulas. With an Excel Workbook, users can easily visualize their data by creating charts and graphs. Additionally, with its powerful functionality, users can automate their workflow and perform data analysis. Overall, an Excel Workbook is a great tool to organize, analyze and efficiently present data.
The main benefit of using an Excel Workbook is its flexibility - it allows users to create tables, control formulas, and customize their views with ease. Additionally, users can use powerful built-in functions to calculate values such as sums, averages, and variances. Furthermore, Excel provides a variety of features to make it easier for users to sort and filter their data.
In addition to its versatility and flexibility, an Excel Workbook can also help reduce the risk of errors in your data. With its built-in error checking and alerting, users can detect any mistakes quickly, allowing them to make corrections as needed. Additionally, by using Excel's powerful auditing tools, users can track changes in their data and ensure accuracy.
Excel Data and Tables
Excel data and tables are collections of information that are organized in columns and rows, making them easy to read and use. Excel tables allow you to sort, filter, or pivot the data so that it can be better understood. They also provide helpful visualization tools like charts, graphs, and pie charts which help users make sense of the data quickly and accurately. With the help of Excel tables, users can easily and quickly analyze data to make better business decisions. Furthermore, Excel data and tables can be used for a variety of purposes such as financial analysis, sales forecasting, project management, and more. As such, Excel data and tables are essential tools for organizations to effectively organize and analyze information.
Excel Calculations on Data
Excel calculations on data allow businesses to analyze and interpret their data efficiently. These calculations can help with various tasks including budgeting, forecasting, reporting, and trend analysis. Excel calculations are an important part of any business’s data management strategy as they provide insights into the data that would otherwise be difficult or impossible to discern. Using Excel calculations, businesses can get a better understanding of their data and use that knowledge to make more informed decisions. Excel calculations can also be used to automate certain processes, such as those involving large sets of data. By automating these processes, businesses can save time and resources while gaining an even greater understanding of their data. Excel calculations are an invaluable tool for businesses looking to make the most of their data.
Excel Spreadsheet Formatting
Excel spreadsheet formatting is the process of organizing data within a spreadsheet so that it's easier to analyze and interpret. This includes things like adding titles, adjusting column widths, using colors, fonts, and borders for emphasis or clarity, freezing panes to keep certain rows or columns onscreen at all times, hiding rows or columns to focus on the necessary data, adding formulas to calculate values or totals, and using filters to help you find what you are looking for quickly. Formatting can take a lot of time, but it's worth the effort if you want your spreadsheet to be organized and professional-looking. With proper formatting, it is much easier to make sense of large amounts of data and draw meaningful insights. Excel offers a variety of tools to help users create visually appealing, organized spreadsheets that are easy to understand. With a little bit of practice, you can make your Excel spreadsheets look great and save yourself time in the long run.
The key to successful Excel spreadsheet formatting is consistency. Make sure that you are consistent with color coding, font size, and text alignment throughout the entire document. This will help readers quickly skim the data and get a good sense of what is happening. It will also make it easier for you to update the information in the future. With a few simple steps, you can turn your Excel spreadsheet into an organized, professional-looking document that will impress both colleagues and clients alike.
Good formatting can also help prevent mistakes when entering or manipulating data. If your cells are not labeled correctly, it can be easy to mix up numbers or even enter them in the wrong order. Formatting the spreadsheet correctly from the beginning will help ensure that all of your data is correct and organized.
Excel spreadsheet formatting is an important part of creating a professional report or presentation. By taking the time to format your spreadsheet correctly, you can ensure that your data is organized, easy to read and understand, and visually appealing. With a little bit of practice and some creative thinking, you can make your spreadsheets look great and save yourself time in the long run.
Excel Charts and Graphics
Excel charts and graphics are visual representations of data that enable quick insights and analysis. They provide a clear picture of the relationships between different pieces of information, allowing users to spot patterns, predict trends, and make better decisions. Charts come in various forms such as bar graphs, pie charts, histograms, line graphs, area plots, scatter plots, and more. Graphics such as icons and pictures can also be used to further illustrate important points or highlight key information. Excel provides a range of tools to help construct visually appealing charts and graphics that are easy to understand. These tools make it easier than ever for users to quickly create sophisticated visuals that accurately convey their message. By leveraging the power of Excel charts and graphics, users can make informed decisions backed up by solid data-driven evidence.
Additionally, Excel allows users to customize the look of their charts and graphics so they stand out from the crowd. By using formatting options such as color palettes, font sizes, borders, and shadows, users can create visuals that are eye-catching and professional. This makes it easier to effectively communicate complex information in a visual format that is easily understood by their audience. Excel charts and graphics provide an invaluable tool for users who want to make sense of the data they have at hand, helping them to make informed decisions with confidence.
Overall, Excel charts and graphics offer an effective way for users to quickly analyze data and gain insight into trends. They provide a powerful tool for making better decisions backed up by real evidence. By customizing the look of their visuals, users can create eye-catching visuals that succinctly communicate complex information clearly and understandably. Excel charts and graphics are invaluable for anyone wanting to gain a better understanding of their data.
Printing Options for Excel Worksheets
Printing Excel worksheets are a great way to quickly create a hard copy of your data. There are several options available depending on what you need the printed version for.
You can opt to print the entire document or just the selected area. Additionally, you can change page settings such as orientation and paper size, as well as page breaks, gridlines, and headings.
You can also customize the print area by selecting a range of cells to be included in the output. This allows you to focus on only the relevant data for your current needs. You can save time by not having to reprint or reformat large documents each time you make changes to a small portion of your data.
If you need to scale your worksheet, such as to fit on one page, you have the option to reduce or enlarge it by percentage to achieve the desired size. Furthermore, you can choose to print column and row labels so that they appear on each page.
Overall, Excel offers a variety of printing options to make sure that you get the exact output you need. Whether your goal is to save time or create an easily readable hard copy, there are plenty of features available to suit your needs.
By taking advantage of these print options for Excel worksheets, you can quickly and easily create a professional and organized hard copy of your data. This will help ensure that your work is accurate, efficient, and visually appealing.
Remember to preview the output before sending it to print to make any final adjustments or corrections. With these helpful tools at your disposal, you can confidently produce quality documents with ease.
Microsoft Excel Intermediate Skills
Excel Intermediate skills are essential for effective data analysis and reporting. By mastering these skills, one can unlock the potential of Excel to process, understand and interpret complex datasets quickly and accurately. They provide users with meaningful insights which enable them to make informed decisions that add value to their business operations. Intermediate Excel skills help streamline processes, reduce errors and boost productivity in the workplace. Excel Intermediate skills are key for any employee who wishes to remain competitive in the ever-evolving digital landscape. They enable professionals to automate complex tasks, simplify their workflow and manipulate data with greater confidence, thus ensuring accuracy and efficiency in their daily operations.
Learn the skills below in our Excel - Level 2 or Excel - Combo (Levels 1-3) courses:
Excel Calculations on Data
Excel offers a wide range of powerful tools to help users make calculations on data. From simple addition and subtraction to more complex statistical functions, Excel can provide you with the detailed insights you need. With an intuitive user interface, it makes calculating data easy and efficient. You can quickly enter formulas that will automatically calculate your desired result or set up more advanced calculations such as regression and exponential smoothing. Excel also offers a range of charting options to help you visualize your data in an easy-to-understand format. By using the powerful tools available in Excel, you can quickly turn raw data into meaningful insights that can be used to inform decision-making. With the right calculations, Excel can help you analyze trends and uncover valuable information to support your business.
As with all data analysis tools, you must understand how to use Excel correctly to get accurate results. It is also essential that you check your results thoroughly before relying on them in any way. Having a firm grasp of formulas, functions, and charting techniques is essential for ensuring the accuracy of your calculations and analysis. With a comprehensive understanding of Excel calculations on data, you can make informed decisions that are based on reliable information.
Overall, Excel provides an array of tools to help you quickly and easily calculate data to gain insights into trends or patterns. With the help of Excel, you can make better decisions based on reliable and accurate data.
Management Options for Excel Worksheet Data
Excel worksheets provide a powerful platform for collecting, organizing, and analyzing data. Managing the worksheet data effectively is key to unlocking its full potential. Common management options include sorting, filtering, formatting, pivoting, linking sheets/workbooks together, and more. By taking advantage of these tools you can quickly manipulate and analyze your data in efficient and meaningful ways. Additionally, a wide range of pre-built functions can be used to analyze data in various ways such as summing, averaging, or finding the maximum and minimum values. All these options allow you to get the most out of your data and make decisions with confidence. With an understanding of Excel worksheet management tools, you will have more control over your data and be able to use it more effectively.
Excel offers a wide range of tools for you to manage worksheet data. By taking advantage of these tools you can quickly and easily manipulate and analyze your data in efficient and meaningful ways. This will allow you to get the most out of your data, make better decisions and get more value out of your data.
Excel Reordering and Summarizing Options
Excel offers a range of options when it comes to reordering and summarizing data. With features such as sorting, filtering, grouping, subtotaling, and pivot tables, users can quickly make sense of large amounts of data.
Sorting allows you to arrange your data alphabetically or numerically in either ascending or descending order.
Filtering allows you to isolate specific data and hide other values that are not relevant. Grouping enables users to combine related data, making it easier to draw meaningful conclusions from the information.
Subtotaling and pivot tables help summarize large amounts of data into more manageable chunks. With these features, Excel makes it easy for users to organize and analyze their data. With a few clicks, users can quickly gain insight into the data and make informed decisions.
Excel's reordering and summarizing options are invaluable for anyone who needs to understand large sets of data. These features allow users to quickly get the information they need, helping them save time and be more productive. Excel's reordering and summarizing options make it easy for users to gain insight into their data and make more informed decisions. By leveraging the power of these features, users can take control of their data and unlock its full potential.
Options to Combine Data From Multiple Sources in Excel
When dealing with data from multiple sources, Excel can provide a range of options to combine the data into one sheet. Common methods include using formulas such as VLOOKUP, INDEX, and MATCH or combining the sheets using the Consolidate function.
Using formulas is a powerful way of combining data from two or more files in Excel. VLOOKUP is a type of formula used to look up specific information from one sheet and display it on another. INDEX and MATCH are formulas that work together to match values from different sheets, columns, or rows.
The Consolidate function enables users to combine data into a single sheet by selecting the ranges they want to consolidate and specifying the function to use, such as sum or average. Consolidating data in this way allows users to quickly summarize and analyze larger sets of information from multiple sources.
Excel also provides external data query options that allow users to connect to data stored in other formats, including databases and web pages. This enables users to keep their workbooks up to date with the latest data.
Overall, Excel offers various methods to combine data from multiple sources into one sheet, enabling users to quickly and efficiently summarise large amounts of information.
Analyze Alternative Data Sets
One of the most popular tools for analyzing alternative data sets in Excel is Pivot Tables. A Pivot Table allows users to quickly summarize, analyze, explore and present large amounts of data. It can group and sort information, calculate subtotals and create charts that make it easy to identify patterns or trends. Another useful tool in Excel is the Solver Add-in, which helps users optimize various types of models. It can provide a solution to the challenge of determining how best to allocate resources, minimize costs and maximize profits. Lastly, the Conditional Formatting feature allows users to format data based on specific criteria so they can identify trends or patterns in their data set. These features, among others, make Excel an ideal tool for analyzing alternative data sets.
By taking advantage of the powerful tools in Excel, users can quickly and easily analyze alternative data sets to gain valuable insights and make better decisions. As the world of alternative data continues to grow, Excel is an invaluable resource for exploring and understanding this valuable asset.
Collaboration Features
Microsoft Excel offers a range of collaboration features that make it easier for users to work together on spreadsheets. These include the ability to share workbooks, which allows multiple people to view and edit documents at the same time; co-authoring which allows files to be edited by two or more people simultaneously; chat feature which allows users to communicate with each other; and alert notifications which will let users know when changes have been made to the workbook or when comments have been added. Excel also allows users to track changes, so they can better understand why certain edits were made or identify who is responsible for any mistakes. With these tools, Excel makes it easier than ever for teams to collaborate on spreadsheets and work together on projects more efficiently.
Excel also offers another great way to collaborate: version control. Version control allows users to maintain a history of all changes made to the spreadsheet, providing an extra layer of security and accountability when making edits or deleting data. The feature is especially useful for teams as it allows them to monitor major changes and easily revert to earlier versions should an issue arise. This tool also allows users to quickly identify the source of a problem or mistake, further enhancing collaboration and productivity. Excel's version control feature is yet another way that Microsoft has made it easier for teams to collaborate on spreadsheets.
Overall, Microsoft Excel offers a wide variety of collaboration features that make it easier for users to work together on spreadsheets. These tools allow teams to share workbooks, co-author documents, chat with each other, receive notifications when changes are made, and track changes so they can better understand the reasoning behind edits. Version control is also available to maintain a history of all changes made and easily revert to earlier versions should an issue arise. With these tools, Excel makes it easier than ever for users to collaborate and work together on projects more efficiently.
Microsoft Excel Advanced Skills
Excel advanced skills are essential for many professionals, especially those in the business world. With these skills, you can easily manage and analyze data, create detailed reports and visualizations, and automate complex tasks. Advanced Excel skills provide users with the ability to make better decisions faster by allowing for more comprehensive analysis of large datasets. Knowledge of advanced Excel functions allows users to create sophisticated models that can be used to forecast future trends and predict outcomes. By learning how to use some of the most powerful features available in Excel, you can save time and energy when tackling complex problems. With these skills, you can make smarter decisions faster and increase your productivity.
Learn the skills below in our Excel - Level 3 or Excel - Combo (Levels 1-3) courses:
Techniques to Analyze Alternative Data Sets
Analyzing alternative data sets in Excel can be a complex task. However, some techniques can be used to make the process easier.
One of the best ways to analyze alternative data sets is by using formulas and functions. This allows you to quickly calculate values on multiple columns or rows at once without having to enter each value. Additionally, formulas and functions can be used to filter data sets by certain criteria, making it easier to find the needed information.
Another useful technique is conditional formatting. This feature allows you to easily identify patterns in data sets by highlighting values that meet certain conditions. For example, if you wanted to highlight all negative numbers in a given column, you could use conditional formatting to quickly do so.
Pivot tables are also a powerful tool for analyzing alternative data sets in Excel. This feature allows you to easily reorganize data by certain factors, such as dates or categories, making it much easier to identify trends and patterns. Furthermore, pivot tables can be used to calculate averages or totals, making data analysis much more efficient.
Finally, macros can be used to automate certain tasks when analyzing alternative data sets in Excel. Macros allow you to record a sequence of commands and run them again and again with the press of a button, saving time and effort. This makes it easier to process large amounts of data quickly and accurately.
Overall, Excel offers a range of powerful techniques for analyzing alternative data sets. By making use of formulas, functions, conditional formatting, pivot tables, and macros, it's possible to effectively analyze alternative data quickly and accurately. With the proper knowledge and practice, any analyst can become proficient in these methods for more effective data analysis.
PivotTables
PivotTables in Excel allows users to quickly and easily summarize, analyze, explore and present their data. They are an incredibly powerful tool that can transform large sets of data into meaningful information in a few simple steps. PivotTables enable users to manipulate the structure of the data by dragging and dropping fields within the table, allowing them to quickly explore different views of the data. They can also easily filter and sort information, as well as create calculations and perform statistical analyses. With PivotTables, users can quickly identify trends within large datasets, helping them to make more informed decisions. By creating dynamic charts and diagrams on top of the PivotTable structure, users can engagingly visualize their information. PivotTables make it easy to explore their data and gain insights that can help inform decision-making.
PivotTables are a great feature in Excel, making it easier for users to quickly analyze their data and draw meaningful conclusions from it. By utilizing the power of PivotTables, users can quickly get to the heart of their data and gain insights that can help them make better decisions. By exploring different views of their data, users can also identify trends that may otherwise go unnoticed. With PivotTables in Excel, users are empowered to easily turn large amounts of information into actionable insights.
In conclusion, PivotTables in Excel are an incredibly useful tool that can help make data analysis simpler and more effective. With its intuitive drag-and-drop interface, users can quickly summarize large datasets and explore different perspectives of the data. By using PivotTables to identify patterns and trends, users can gain valuable insights which can help inform their decision-making.
PivotCharts
PivotCharts are interactive graphical representations of PivotTable data in Microsoft Excel. They enable users to make better sense of their data by providing visual summaries and insights into patterns, trends, and relationships within the data. They can be used to compare different categories of information or highlight key values. By manipulating the chart, users can explore different views of the data, allowing them to analyze and gain insight into their information more quickly and efficiently. Additionally, PivotCharts can be used to create visually appealing presentations with dynamic charts that update in real time when changes are made to the underlying data. This makes them an invaluable tool for businesses looking to make informed decisions based on up-to-date data. PivotCharts can be created from existing data or as part of a new PivotTable. Once the chart is generated, it can be formatted and customized to match the user's needs. With this powerful tool at their disposal, users can gain deeper insights into their data than ever before.
PivotCharts are an essential component of any data analysis process, and their use is becoming increasingly common in business environments. They give users a way to visualize their data to quickly identify important trends and relationships. By creating meaningful visuals from complex sets of data, PivotCharts help make decisions easier and faster. With the help of PivotCharts, users can quickly and efficiently identify patterns, trends, and relationships in their data that would otherwise be difficult to uncover. This makes them an invaluable tool for businesses looking to make informed decisions based on up-to-date data.
In conclusion, PivotCharts are an invaluable tool for making sense of data. They provide users with an interactive and visually appealing way to analyze their data, enabling them to identify patterns, trends, and relationships quickly and efficiently. With the help of these dynamic charts, businesses can gain deeper insights into their data than ever before. This makes PivotCharts a must-have tool for any data-driven business looking to make informed decisions.
Automate Excel Tasks and Input
One of the most efficient ways to automate Excel tasks and input is through macros. Macros are a powerful tool that allows users to record sets of instructions and assign them to a single keystroke or command, such as shortcut keys, buttons on an Excel ribbon, or even an external button. This makes it possible for users to enter repetitive data into an Excel spreadsheet without having to do any manual input. Macros are also useful for automating tedious tasks like creating charts, analyzing data, and performing calculations. Another way to automate Excel is with the use of add-ins. Add-ins allow users to access additional features or functions in Excel that they could not access before. With add-ins, users can quickly and easily complete tasks that may otherwise take hours or days to accomplish. Finally, automation tools such as VBA (Visual Basic for Applications) make it possible for users to write custom code that can perform complex tasks with minimal effort. Automation tools like VBA allow users to create powerful Excel scripts that can automate data entry, calculations, reporting, and more. With the help of these tools, users can make Excel an even more powerful tool for organizing, analyzing, and presenting data.
All in all, automation tools are a great way to reduce tedious tasks and increase efficiency with Excel. Whether using macros, add-ins, or VBA scripts, users can quickly and easily automate tasks and input in Excel to save time and effort. With the help of automation tools, users can take full advantage of the power of Excel to quickly process data and provide meaningful insights. Consequently, automating Excel tasks with macros, add-ins, or VBA scripts is a great way to increase productivity while reducing manual labor. By leveraging automation, users can make the most out of their data and get more done in less time.
Microsoft 365 Apps Integration With Excel
Microsoft Excel is a powerful and versatile spreadsheet application that enables users to create complex spreadsheets as well as analyze, visualize, or manipulate data. It also offers tight integration with several Microsoft 365 apps, such as Outlook, OneDrive, Teams, Yammer, and Planner. This makes it possible for users to manage their workflows within the same application and to collaborate easily. With Outlook integration, users can quickly send emails directly from Excel, while OneDrive enables them to store their work in the cloud for easy access anywhere. Excel is also integrated with Teams, Yammer, and Planner for more efficient collaboration among teams. The combination of these features makes it easier for users to manage their tasks and collaborate with colleagues from anywhere. Microsoft Excel is thus a powerful and versatile tool for creating, analyzing, and managing data.
Additionally, Excel offers several other integrations to give users even more control over their workflows. It integrates with Flow for automated workflow tasks, Power BI for interactive data visualizations, SharePoint for secure document storage, and PowerApps for custom business processes. Excel also connects with several third-party applications such as Salesforce or QuickBooks, making it possible to track sales figures, view customer orders, or manage financial data. The wide range of integrations makes Microsoft Excel an indispensable tool for businesses of all sizes.
With its comprehensive set of features and integrations, Microsoft Excel is a powerful tool for managing data. Whether it’s creating spreadsheets, visualizing data, collaborating with colleagues, or automating tasks, Excel offers a range of tools to make workflows more efficient. From Outlook integration to third-party applications such as Salesforce, Microsoft Excel has become an essential application for businesses looking to maximize their productivity.
Excel Business Intelligence Analysis Tasks
Business intelligence analysis tasks that can be done with Excel include managing data, creating reports and dashboards, forecasting results, and analyzing trends. With the help of Excel's powerful functions, users can quickly manipulate their data to discover patterns in their data sets. Additionally, Excel's built-in visualization tools such as charts and graphs make it possible to present the data in an easy-to-understand manner. Excel's PowerPivot feature also allows users to create sophisticated models for further analysis, such as regression analysis or clustering. Furthermore, Excel’s expansive library of add-ins makes it a powerful tool for more advanced business intelligence tasks, such as complex financial modelling and forecasting. Finally, Excel's ability to integrate with other applications, such as Power BI and Tableau, makes it a great choice for data-driven decision-making. All of these powerful features make Excel an incredibly versatile tool for business intelligence analysis tasks.
Ultimately, Excel is an invaluable tool for businesses looking to gain insight from their data. Its versatile features, powerful data manipulation capabilities, and integration with other applications make it an ideal platform for business intelligence analysis. With Excel, users can quickly create meaningful reports and analyses that can provide valuable insights into their data. Ultimately, the potential of Excel as a business intelligence tool is limited only by the user’s creativity and ambition.
Forecasts and Visualizations
Forecasts and visualizations in Excel are powerful tools for making data-driven decisions. They allow users to quickly analyze large amounts of data, spot trends and make informed decisions. With the ability to create various types of graphs and tables, users can effectively present their findings clearly and concisely. Forecasts also help to identify potential risks and opportunities, while visualizations can help break down complex problems into manageable components. All of this makes forecasts and visualizations an important part of any business analysis process. Excel's forecasting capabilities and visualization options provide users with the power to make better decisions that are backed by data-driven evidence. This makes it easier for businesses to identify areas for improvement and make the most of their resources. Excel's forecasting and visualization capabilities are a great way to make data-driven decision-making to the next level.
In addition, Excel's forecasting capabilities can help businesses create more accurate projections for future performance. This allows businesses to be better prepared for changes in the market and anticipate potential risks and opportunities. Furthermore, detailed visualizations make it easier to monitor progress and spot new trends, helping business owners stay ahead of the competition. By combining forecasting capabilities with intuitive visuals, Excel users can create an effective dashboard that will give them all the data they need to make informed decisions.
In conclusion, forecasts and visualizations in Excel are powerful tools for data-driven decision-making. They provide users with the ability to quickly analyze large amounts of data, spot trends, and create accurate projections for future performance. With intuitive visuals and forecasting capabilities, Excel makes it easier than ever to make educated decisions that are backed by evidence.
Microsoft Excel Dashboards Skills
Excel dashboard skills are incredibly important for any data analyst or business professional. With the right Excel dashboard, you can quickly and easily visualize complex data in a way that's easy to understand. Dashboards provide an effective way to monitor various aspects of a business – from performance indicators to customer satisfaction ratings – enabling decision makers to make informed decisions in a timely fashion. They also make it easier to detect areas of improvement and opportunities for growth – allowing professionals to plan, track, and optimize their operations with greater efficiency. Excel dashboards can also be used to identify relationships between data points and summarize complex information into actionable insights – making them an invaluable tool for any professional who handles large amounts of data.
Learn the skills below in our Excel - Dashboards course:
Basics of Excel Data Analysis
Excel is a powerful tool for data analysis. It has numerous features that allow users to manipulate, analyze, and visualize their data. Excel can be used to identify trends and patterns in large datasets, perform calculations on multiple sets of data, and create charts and graphs to help present the information more clearly. Excel also has built-in functions that provide statistical analysis to help you make data-driven decisions. Using Excel can help increase the accuracy of your data and provide insights that would be difficult to uncover with other methods. With the right techniques, Excel can be a powerful tool for exploring information and drawing meaningful conclusions from data. Learning how to use Excel for data analysis is an essential skill for any business professional.
Excel Data Visualization
Excel data visualization enables users to view and present their data sets in a more organized, straightforward manner. It allows for quick analysis and understanding of complex relationships between different variables in the dataset. Data is presented using graphical elements such as bar graphs, line charts, pie charts, scatter plots, etc., which can be customized to better illustrate insights. Excel data visualization can be used for a variety of purposes, including understanding customer trends and behaviors, analyzing financial performance, tracking sales and marketing performance, forecasting future demand, and more. With the help of data visualization, users can quickly identify trends, spot opportunities, and develop strategies that have a greater impact on their business. Excel data visualization allows organizations to make data-driven decisions for their businesses, which can result in better decision-making and higher performance. Data visualization is also a powerful tool to communicate insights to stakeholders. Being able to represent complex data clearly and visually, improves understanding of the reported results and increases engagement with the presented information. Overall, Excel data visualization makes it easier for users to understand, manipulate, and report data.
By leveraging this powerful tool, users can gain valuable insights from their datasets and make more informed decisions that can have a positive impact on the success of their business. With the help of Excel data visualization, organizations can better analyze trends and spot opportunities for growth. It is increasingly becoming an integral part of decision-making processes within organizations.
Analyzing Excel Data With Formulas and Functions
Analyzing data in Excel with formulas and functions is a powerful tool for uncovering insights and drawing conclusions, enabling organizations to drive informed decision-making. It can be used to perform complex calculations, create charts and graphs, apply conditional formatting, identify trends, verify the accuracy of input data or compare values across multiple datasets. Formulas and functions allow users to quickly and effectively manipulate data, enabling easy access to the information needed for analysis. Excel's powerful analytical capabilities allow users to explore vast amounts of data, uncover correlations and relationships that may have otherwise gone unnoticed and gain actionable insights from their findings. Ultimately, Excel is an invaluable tool for businesses seeking to maximize their use of data and drive growth.
Analyzing Excel Data With PivotTables
Analyzing data with Excel and PivotTables is a powerful tool for uncovering insights from complex datasets. With the ability to create visualizations, sum and count values, find averages and trends, highlight top performers, and more, PivotTables can help users quickly identify important facts and draw conclusions from their data. This capability makes it a powerful tool for businesses and organizations to uncover trends and make more informed decisions. By setting up PivotTables, users can quickly explore their data to find answers that may have not been previously apparent. With the right setup, users can see patterns or correlations with a few clicks of their mouse. This saves time and energy while finding important facts that may be hidden in the data. Furthermore, PivotTables are dynamic and can easily be updated to reflect new or modified data sets. This allows users to quickly respond to changing conditions without having to start from scratch. With Excel and PivotTables, exploring and analyzing data has never been easier!
Excel Dashboards
Excel dashboards are powerful data visualization tools that allow users to quickly interpret large amounts of data by displaying information in a logical and easy-to-understand manner. Dashboards typically contain graphical representations, such as charts or graphs, that help to highlight key trends or insights from the data being examined. This makes it easier for individuals and organizations to take meaningful actions based on the data, such as identifying areas of improvement or determining further action plans. Excel dashboards are dynamic and interactive, allowing users to filter and drill down into specific information with just a few clicks. As such, they provide an efficient and effective way of summarizing large amounts of data in one place. Furthermore, Excel dashboards can be easily shared, allowing users to collaborate on and discuss data more effectively. With a well-designed Excel dashboard, organizations and teams can gain more insights from their data, leading to better decision-making and improved overall performance.
Excel dashboards provide users with a comprehensive overview of the data they are examining and enable them to quickly identify patterns and relationships. Excel dashboards can be used to track performance metrics, compare different scenarios, or analyze trends over time. By utilizing features such as conditional formatting, slicers, and interactive charts, users can easily customize their dashboards to meet their specific needs. Dashboards can also be used for predictive analytics so that users can anticipate future trends and focus on potential opportunities for improvement. With Excel dashboards, organizations are better equipped to make data-driven decisions which lead to increased efficiency, productivity, and better performance overall.
Microsoft Excel PivotTable Skills
Excel PivotTable skills are essential to businesses as they enable us to quickly organize and analyze large amounts of data. This allows us to make informed decisions, improve efficiency and uncover hidden trends or patterns in the data. With PivotTables, we can summarize complex data sets quickly by creating dynamic summaries that can be easily manipulated with a few clicks. PivotTables can be used to uncover trends and relationships not easily visible in raw data. This helps us to make better business decisions more efficiently. By mastering Excel PivotTable skills, you are able to gain valuable insights from your data that would otherwise remain hidden or take too long to uncover.
Learn the skills below in our Excel - Data Analysis with PivotTables course:
Excel PivotTables
Excel PivotTables provide users with a powerful tool for data analysis. Leveraging the power of pivot tables can help users quickly summarize, analyze, explore and present their data in ways that reveal important trends and relationships. By organizing large sets of data into smaller segments, pivot tables enable users to discover hidden correlations between variables that would otherwise remain hidden. Excel PivotTables can be used to compare different periods, create forecasts and analyze large datasets. Additionally, pivot tables can display hundreds of thousands of data points in one organized table quickly and easily. By taking advantage of the features available in Excel PivotTables, users can gain valuable insight into their data and make informed decisions based on the results. Through their ability to quickly summarize and visualize data in an organized manner, Excel PivotTables are a valuable asset for any user looking to gain insight into their data.
Analyzing Data With Excel PivotTables
Analyzing data with Excel PivotTables is an essential tool for any business. It allows you to quickly and easily manipulate large amounts of data into meaningful insights. PivotTables are great for analyzing trends, identifying patterns, and making decisions based on the information presented. With this powerful feature, you can analyze data across multiple dimensions to uncover trends, identify outliers, and draw conclusions. With PivotTables, you can easily filter data to answer specific questions, spot opportunities, and make informed decisions that will benefit your business. By taking the time to understand how to use Excel PivotTables, you’ll be able to increase the productivity of your team and maximize the value of your data. Additionally, PivotTables allow you to quickly and easily track performance metrics over time, allowing you to make better decisions based on the data available. With these powerful tools at your disposal, any business can use Excel PivotTables to gain valuable insights into their operations and make smarter decisions that will lead to greater success. By properly leveraging the power of data with Excel PivotTables, you can unlock hidden insights and unlock your business’s full potential.
Working With Excel PivotCharts?
PivotCharts are powerful tools for visualizing and presenting data. They provide an effective way to easily analyze, compare and explore raw data. Working with PivotCharts can be done in several ways:
1. Existing Data Analysis – When working with existing data sets, you can use the PivotChart feature to quickly analyze the data. With PivotCharts, you can quickly identify trends and relationships between different elements of your data set.
2. New Data Analysis – You can also use PivotCharts to create new analyses from raw, unprocessed data. By dragging and dropping fields into a chart area, you can quickly break down large amounts of data into more manageable pieces for further investigation.
3. Data Presentation – PivotCharts provide an effective way to present your data in a visually appealing format. By using the chart's formatting and design features, you can easily create charts that are both informative and attractive.
4. Interactivity – You can also use PivotCharts to let your audience interact with the data. By allowing your viewers to manipulate and explore the chart elements, you can help them gain new insight into the data.
5. Collaboration – Working collaboratively on PivotCharts can be useful for teams of any size that need to analyze or present data. With features such as shared workspaces and the ability to assign tasks, teams can easily work together on a single chart.
Overall, PivotCharts are powerful tools for working with data. From existing analysis to new data exploration and presentation, they provide you with an effective way to visualize and understand your data. With features such as interactivity and collaboration, you can make the most of your data and ensure that it’s presented engagingly. By using PivotCharts, you can quickly and efficiently analyze, explore, present, and collaborate on raw data sets.
Microsoft Excel VBA Programming Skills
Excel VBA skills are invaluable for increasing efficiency and accuracy in the workplace. With VBA skills, it is possible to automate simple or complex tasks that would otherwise take up a lot of time if done manually. It also enables businesses to customize their spreadsheets to best suit their particular needs. VBA can help build sophisticated models which can be used to quickly analyze and visualize data. VBA is also useful for creating custom user interfaces that make navigation of spreadsheets more intuitive and easier to use. Having Excel VBA skills provides a range of benefits, from increased efficiency and accuracy to better data analysis capabilities and improved user experience.
Learn the skills below in our Excel - VBA Programming:
Excel VBA - Visual Basic for Applications
Excel VBA (Visual Basic for Applications) is an event-driven programming language developed by Microsoft that enables users to automate tasks within Excel. It helps in creating user-defined functions, automating workbooks, and manipulating various objects such as worksheets, cells, databases, and so on.
With the help of Excel VBA, one can perform various tasks such as creating custom functions and forms, manipulating data, making interactive graphs and dashboards, etc. Furthermore, Excel VBA can be used to integrate other Office programs such as Word, Access, Outlook, and PowerPoint into an automated workflow.
By using Excel VBA, users can automate their daily tasks in Excel with greater efficiency and accuracy, thereby saving time and energy. Excel VBA is an incredibly powerful tool, enabling users to develop robust solutions that can be used to solve complex problems. With a little imagination, it can even be used to create some extraordinary applications. Ultimately, Excel VBA has no limits – the only thing holding you back is your knowledge and creativity.
Excel VBA Procedures and Functions
Excel VBA procedures and functions provide a way to create powerful macros that can automate certain processes. These procedures and functions are referred to collectively as Visual Basic for Applications (VBA). This set of instructions, in the form of algorithms, can be used to control Excel’s behavior and make it more efficient. Procedures and functions can be used to perform a wide range of tasks such as looping, sorting, filtering, and formatting data. They can also be used to automate repetitive activities like data entry or calculations.
By leveraging the power of VBA procedures and functions, users can save time and effort while increasing the accuracy of their Excel spreadsheets. Additionally, procedures and functions are not limited to Excel; they can be used in other programs such as Word and PowerPoint. Therefore, understanding how to write VBA procedures and functions is a valuable skill for anyone who wants to boost their productivity while working with Microsoft Office applications. By creating custom macros, users can maximize their time and increase their efficiency.
VBA is a powerful tool that provides users with the flexibility to create automated tasks tailored to their specific needs. When used correctly, VBA procedures and functions can greatly reduce time spent on data entry and calculations while increasing accuracy. With a little practice and know-how, users of all levels can take advantage of the power of Excel VBA.
Excel VBA Objects
Excel VBA objects are the components that make up a Visual Basic for Applications (VBA) program. They comprise collections, classes, properties, and methods that allow users to manipulate data and automate tasks or processes in Excel. The objects that are available with VBA include worksheets, charts, ranges, and forms. By using these objects, it is possible to create powerful and complex programs that can make working with data in Excel a whole lot easier. With the help of Excel VBA objects, users can easily manipulate data from one sheet to another, delete rows or columns, set up filters, and so on. In addition to this, VBA objects provide users with the ability to create custom functions, which can greatly improve how data is handled in Excel. Furthermore, users can use VBA to develop and run macros that perform a variety of tasks with great accuracy and speed.
VBA objects are an incredibly powerful tool for those who wish to make working with Excel more efficient. With so many different objects available, it is easy to see why VBA has become a widely used programming language for those working with Excel.
Excel VBA Expressions, Variables and Intrinsic Functions
Excel VBA Expressions are a combination of variables and intrinsic functions used in Visual Basic for Applications (VBA) programming to perform different tasks. Variables are values that can change, while intrinsic functions are built-in commands used to execute specific operations within the program. By combining the two, Excel VBA Expressions enable users to create powerful programs for automating and streamlining tasks. Intrinsic functions can be used to access information from the worksheet, such as column or row numbers, and perform operations such as calculations and sorting data. Variables allow users to store values in memory and easily pass them between different parts of the code. With Excel VBA Expressions, users can create powerful commands to automate tasks, such as creating reports or performing complex calculations. By combining the power of Excel VBA Expressions and Variables with the built-in Intrinsic Functions, users can maximize their efficiency in using Excel and increase their productivity.
In summary, Excel VBA Expressions are a powerful combination of Variables and Intrinsic Functions. By using them, users can automate tedious tasks, access data from the worksheet quickly, and perform complex calculations to increase efficiency and productivity. With Excel VBA Expressions, users can maximize their use of Excel for any given task or project.
Excel VBA Program Execution Control
Excel VBA Program Execution Control is a set of commands and techniques used to control how programs written in Visual Basic for Applications (VBA) are executed. This includes controlling the order of execution, breaking up large blocks of code into smaller sections, looping through multiple tasks, and even creating subroutines or functions to be called when needed. By using these techniques, it can become easier to debug and maintain VBA code written in Excel. The use of Program Execution Control also helps ensure that data is manipulated correctly and efficiently, making Excel VBA development more efficient and reliable. All of this leads to improved productivity for you or your organization. Additionally, the use of program execution control can be used to create custom tools for use in your applications.
Overall, Excel VBA Program Execution Control is a powerful and important tool that should be utilized by any Excel VBA developer. It can help improve code readability, maintainability, performance, and even security. By utilizing these features, you can make writing and maintaining complex programs in Excel VBA much easier.
Excel VBA Forms and Controls
Excel VBA Forms and Controls are two powerful tools that can help you extend the functionality of your Excel spreadsheets. Excel forms provide a simple and convenient way to collect data from users, while controls allow for advanced user interaction with your spreadsheet. With the use of these two features, you can create an interactive environment that enables users to interact with your spreadsheet, allowing you to gather data from them quickly and accurately. Forms have a variety of elements that can be used to collect information such as text boxes, checkboxes, combo boxes, command buttons, and many others. Likewise, controls like scroll bars and spin buttons are commonly used for making changes to worksheet data or viewing different parts of a worksheet. Using these two features, you can create an interactive environment for users to interact with your spreadsheet easily and efficiently. With these tools, you can increase the utility of your Excel spreadsheets by improving the user experience.
By leveraging Excel VBA Forms and Controls, you can extend the functionality of your spreadsheets while also providing a user-friendly interface. With the help of these tools, you can create an interactive environment that enables users to interact with your spreadsheets with ease and accuracy. With this experience, they will be able to interact more effectively with your data and gain better insights from it. This also allows you to maximize the utility of your Excel spreadsheets and make them more useful to your users. With the use of these two features, you can create an engaging and interactive experience for your users that will improve their user experience and help them get the most out of your spreadsheet.
Excel VBA PivotTable Objects
Excel VBA PivotTable objects are powerful tools used to analyze and present data. They allow you to quickly summarize large datasets, display trends and uncover relationships that might otherwise be hidden. A PivotTable can also be used to filter and sort the data so you can easily identify patterns or outliers. By leveraging the full functionality of Excel VBA, you can create dynamic and interactive PivotTable objects which are more powerful than ever before. With the right knowledge and experience, you can make your data analysis easier and more efficient with the use of Excel VBA PivotTable objects.
Whether you are a beginner or an experienced analyst, Excel VBA PivotTable objects can help you uncover insights from your data and make more informed decisions. With the right knowledge, you can create interactive reports that show relationships between different variables, enabling greater understanding and improved decision-making capability. Furthermore, by automating your analysis tasks with Excel VBA, you can save time and resources in the long run.
Excel VBA Code Debugging
Excel VBA Code Debugging is an essential part of the software development and debugging process. It allows programmers to identify errors in Excel VBA code, and analyze and correct them before deploying their program for use. With the help of debugging tools, developers can quickly find and fix any issues that may arise from incorrect coding or user input. This ensures that their programs are reliable and up to the standards of their clients. Through debugging, programmers can verify if the program is working as intended and identify any potential issues that may arise in the future. By taking the time to debug their code, developers can save themselves from costly errors and gain a greater understanding of how to properly write code for Excel applications. Ultimately, Excel VBA Code Debugging is an invaluable tool for making sure that your program runs smoothly and efficiently.
Excel VBA Error Handling
Excel VBA Error Handling is a useful tool for dealing with errors that may arise when writing and running Visual Basic for Applications (VBA) code. By using error handling, you can ensure that any unexpected errors are handled appropriately. This makes it easier to debug issues as they occur and helps to improve the quality of your code. Error Handling allows you to set up a procedure that will catch and handle any errors that may occur while the code is running. You can use this feature to create custom error messages, log information on errors, or even exit your program gracefully in case of an unexpected event. By using Excel VBA Error Handling, you can ensure that your code runs reliably, even in the face of unexpected errors. This can help to ensure that your code is robust and reliable and can be used with confidence.
With Excel VBA Error Handling, you can make sure that any unexpected errors are handled appropriately and provide valuable feedback to the user. By setting up a procedure to catch errors, you can provide helpful feedback to the user, log information on errors, and also gracefully exit the program if necessary. This can help to ensure that your code runs as reliably as possible and avoid any surprises! Excel VBA Error Handling provides you with a useful tool for managing unexpected errors so that you can be confident in the quality of your code.
Microsoft Outlook Basic Skills

Setting up and using Microsoft Outlook is essential for any professional or business environment. With the right skills and know-how, Outlook can become a potent tool for organizing emails, managing contacts, scheduling meetings, and creating notes. Having a good understanding of Outlook basics can make communication much more efficient and allow you to complete tasks quickly without constantly referring to a manual or instruction guide. Outlook basics include understanding how to create, send and organize emails and schedule meetings and appointments. Knowing how to customize the layout and use Outlook tools such as address books, task lists, and the calendar can make organizing your time much more accessible.
Learn the skills below in our Microsoft Outlook - Level 1 or Microsoft Outlook Combo courses:
Microsoft Outlook Layout Basics
Microsoft Outlook layout basics include the Inbox, Calendar, Contacts, Tasks, and Notes sections. In addition to these basic sections, you can also access Outlook options such as Settings and Mail Rules. To navigate between the different sections of Outlook effectively, it is important to understand how they are laid out.
- The Inbox contains all emails you have received, as well as your drafts and sent items. You can sort by sender, subject line, or date. To view the contents of an email, simply click on it.
- The Calendar section of Outlook is a great tool for managing appointments, setting reminders, and organizing events. It allows you to quickly add new events and view existing ones.
- The Contacts section allows you to store contact information for people with that you communicate often. You can add new contacts, delete existing contacts, and search for contacts quickly.
- The Tasks section is a great way to keep track of any tasks or assignments that need to be completed. You can assign due dates and prioritize tasks, as well as mark them as completed.
- The Notes section of Outlook is a useful tool for quickly jotting down ideas, thoughts, and other important items. It is easy to add new notes and find existing ones.
Knowing how to navigate effectively between the different sections of Outlook will help you to make the most out of this powerful program.
Microsoft Outlook Modules
Microsoft Outlook is a powerful organizational tool that comes with several modules. These modules provide features to help you manage emails, contacts, calendars, tasks, and more. The following are the main Microsoft Outlook modules:
- Mail Module: Manage emails from multiple accounts in one place. Includes rules for organizing messages and archiving older emails.
- Calendar Module: Manage events, appointments, and meetings in one place. Includes options to set reminders and alerts for upcoming events.
- Contacts Module: Store contact information, including addresses, phone numbers, and email addresses. Also includes the ability to create groups of contacts for the quick distribution of messages or emails.
- Tasks Module: Create and manage lists of tasks and assign them to other individuals. Includes options to set reminders and due dates for tasks.
- Notes Module: Store notes related to contacts, projects, or events. This can be used as a reference tool when needed.
These modules are designed to help you organize and manage your emails, contacts, calendars, tasks, and more in one easy-to-use program. With each module providing a different set of features, you can customize Outlook to fit your organizational needs. Additionally, you can use various features within each module to further tailor the way you work with Microsoft Outlook. By taking advantage of all the modules and features available, you can increase your productivity and better manage your data. With Microsoft Outlook as a powerful organizational tool, you'll be able to do more in less time.
Microsoft Outlook Sending and Receiving Functions
Microsoft Outlook is a powerful email and personal information management program that provides users with efficient ways to manage their data. The sending and receiving functions of Microsoft Outlook make it easy for users to stay connected with coworkers, family, friends, and customers.
The sending function in Microsoft Outlook allows you to easily send emails on the go or from the comfort of your own home. You can compose, edit, and attach documents to outbound emails with just a few clicks. Additionally, you can use Outlook’s contact list to quickly select individuals or groups from your address book and send them an email without having to type in their addresses every time.
The receiving function in Microsoft Outlook is just as convenient. All incoming emails are organized into folders that you have specified, allowing you to quickly retrieve and review them in one place. The tool also provides a “junk mail” folder for easy filtering of unwanted messages. Additionally, the program comes with several rules and settings that let you customize how you organize your inbox and filter out unwanted messages.
Overall, the sending and receiving functions of Microsoft Outlook make it an invaluable tool for staying connected with colleagues, family, friends, and customers. With its powerful features and intuitive design, you can send emails quickly and easily while keeping your inbox organized and free from clutter.
Microsoft Outlook Contacts Functions
Microsoft Outlook Contacts can be used to store contact information like email addresses, phone numbers, and pictures. This makes it easy to quickly search for contacts while also having a comprehensive list of all your contacts at your fingertips. It's also possible to group similar contacts which make categorizing them easier when sending out emails or other messages.
Furthermore, Outlook Contacts allows users to sync their contact list with other devices, such as an iPhone or Android device. This makes it easier to quickly transfer contacts from one device to another without having to manually enter the same information multiple times. In addition, Outlook Contacts integrates seamlessly with Microsoft Office applications like Word or Excel and can be used to quickly access contacts when needed.
Ultimately, Microsoft Outlook Contacts provides users with a powerful and reliable way to store and manage their contacts.
Microsoft Outlook Scheduling Management
Microsoft Outlook Scheduling Management is a tool designed to help businesses streamline and automate their calendar management. The program is an intuitive system that works with Microsoft Exchange Server, allowing staff to manage multiple calendars from a single interface. With this feature-rich application, users can arrange meetings or appointments, schedule resources, and services, track the availability of personnel or resources, and share calendars with others. This powerful tool also allows users to set up automatic reminders for upcoming events or tasks, as well as send out personalized notifications through email or text messages.
Through Microsoft Outlook Scheduling Management, organizations can ensure that all their internal operations are running smoothly and efficiently. By simplifying the process of keeping multiple schedules in sync, businesses can save time, reduce costs and improve their overall productivity. With its rich feature set, this powerful scheduling tool is an invaluable asset for organizations that are looking to maximize the efficiency of their operations.
Microsoft Outlook Task Tracking
Microsoft Outlook Task Tracking is a feature within the Microsoft Outlook platform that allows users to easily manage and keep track of tasks. It provides users with the ability to create and assign tasks, set deadlines, mark when tasks are completed, and more. With this feature, users can also contact collaborators on shared tasks, view task status reports in real time, and keep updated with progress alerts. Task Tracking provides users with the ability to stay organized and work efficiently, thus improving overall productivity. Overall, Microsoft Outlook Task Tracking is a valuable tool for businesses that need an efficient way to manage tasks.
By taking advantage of this feature, teams can easily collaborate on tasks as well as monitor progress with detailed reports and alerts. This will help organizations stay on top of their tasks while saving time and money in the process. Microsoft Outlook Task Tracking is an invaluable tool for any business that wants to get the most out of its resources. By using this powerful feature, organizations can maximize their efficiency and productivity to reach greater heights of success.
Window Element Management in Microsoft Outlook
Window Element Management in Microsoft Outlook is a feature that allows users to customize how their inbox appears. This includes the ability to organize, hide, and rearrange different parts of their mailbox window, such as message list view, preview pane, and folder list. Through Window Element Management, users can configure the size and position of each element within their mailbox window, enabling them to create a workspace that best suits their needs. Additionally, Window Element Management allows users to save their customized settings to quickly switch between different layouts as needed. With this powerful feature, Microsoft Outlook gives users the flexibility and control necessary for improved productivity and efficiency.
Microsoft Outlook Advanced Skills
Microsoft Outlook Advanced skills are an essential component of modern business. With these tools, professionals can easily manage emails, calendars, contacts, and tasks in one platform, allowing them to stay organized and productive. Advanced Outlook skills enable users to streamline workflows with calendar sharing and email delegation features. Users can also set up rules for handling incoming emails, saving time and improving efficiency. With the ability to quickly search emails, contacts, and other items, users can easily find what they need.
Learn the skills below in our Microsoft Outlook - Level 2 or Microsoft Outlook Combo courses:
Microsoft Outlook Message Content Enhancement Options
Microsoft Outlook offers several options to enhance message content. These include the ability to format text, apply theme colors and fonts to text, insert tables and hyperlinks, attach files and images, create lists, and more. By utilizing these tools effectively, you can create messages that are both professional and engaging.
Using Microsoft Outlook’s formatting options, you can customize the look of your messages. Text can be made bold or italicized for emphasis, as well as underlined and highlighted. Fonts can be changed to match a particular color scheme or size requirements. You can also apply various themes to text and insert tables with customizable columns and rows.
Hyperlinks are very useful when creating messages in Microsoft Outlook, as they allow readers to quickly find additional information. You can attach files and images directly to your messages and resize or compress them if needed. Additionally, lists can be created with various bullet points, numbering systems, or symbols for easy organization of ideas.
Overall, Microsoft Outlook’s message content enhancement options offer users a variety of ways to make their messages stand out. By using the available formatting options, inserting tables and hyperlinks, attaching files and images, and creating lists, you can create professional and engaging messages that will help communicate your ideas effectively.
Microsoft Outlook Email Security Features
Microsoft Outlook offers some of the best email security features. These features provide a secure environment for users, allowing them to protect their information from malicious actors and other threats.
Outlook's security features include encryption, data loss prevention (DLP), two-factor authentication (2FA), anti-phishing, and malware protection.
Encryption helps to keep data secure by scrambling it so that only authorized users can access it. This feature is especially important for sensitive emails, such as those containing confidential information or personal details. Data loss prevention (DLP) ensures that any potentially-compromised emails are blocked from being sent out of the system, protecting both the sender and the recipient.
Two-factor authentication (2FA) is another layer of security used by Outlook to ensure only authorized users are accessing emails. This feature requires users to enter a code sent to their mobile device or email address before they can access their account, adding a layer of protection. Anti-phishing technology helps to protect users from malicious emails by scanning incoming messages for suspicious links or attachments. Finally, Outlook's malware protection helps detect and block any malicious files before they can harm.
By leveraging these features, Microsoft Outlook provides users with a secure environment for sending and receiving emails. This ensures that confidential data is protected from unauthorized access, giving users peace of mind.
Microsoft Outlook Inbox Organization
Microsoft Outlook provides users with a range of essential tools for managing their inbox. It allows them to create folders, set up rules, and use Inbox Zero to keep their mailbox organized. Features like Quick Steps and Sweep can help users quickly sort through emails in their inbox and prioritize tasks. Additionally, the Conversation View feature enables users to keep their mail organized by sorting emails into threads. For those who need an extra layer of organization, Outlook allows users to create personal folders for important emails and tasks. With these tools, Microsoft Outlook makes it easy for users to keep their inbox organized and streamlined. By taking advantage of the features provided, users can make their mailbox more efficient and effective.
Ultimately, Microsoft Outlook inbox organization can help users stay on top of emails and tasks. The tools available in Outlook allow users to create an organized structure for managing their inbox and increasing productivity. With a well-organized inbox, users can quickly find emails, prioritize tasks, and manage their time more efficiently. Utilizing the features of Microsoft Outlook can help lessen the burden of managing an overflowing mailbox and make it easier to stay on top of important emails.
Microsoft Outlook Contact Management
Microsoft Outlook contact management is an essential component of the Outlook application suite. It allows users to store, organize and manage contacts in one convenient place. With a few clicks of the mouse, you can easily access contact information such as names, email addresses, phone numbers, and other details. In addition to storing contact information, Outlook contact management allows users to link contacts together and create groups. This makes it easy to find the contact information of a person or group quickly. Contact management also helps users remain organized with reminders and email notifications for upcoming events and tasks. Ultimately, Microsoft Outlook contact management is an efficient way to store, manage and organize your contacts. By taking advantage of this feature, users can ensure their contacts are up-to-date and easily accessible. This makes it easier to stay in touch with colleagues, family, and friends. Thus, Outlook contact management allows users to make the most of their contact list and enjoy better communication with those around them.
Microsoft Outlook Calendar Management
Microsoft Outlook calendar management is an efficient way to organize and manage your business activities. It allows you to create, view, edit, and share calendars efficiently with others, enabling businesses of all sizes to stay connected and organized. You can use it to schedule meetings, track deadlines, collaborate on projects, monitor tasks, and share your availability with colleagues. It also features advanced features such as reminders, repeated tasks, customizable views, and integration with popular apps and services. With its powerful set of tools, Microsoft Outlook calendar management can help you optimize your workflow and stay on top of your daily tasks. It is an essential tool for any business looking to improve productivity and manage its time more effectively. With its powerful set of features and customizable options, it can be an invaluable asset in helping you manage your day-to-day activities.
Microsoft Outlook Customization Options
Microsoft Outlook provides a wide range of customization options to help you tailor the software to your needs. You can customize the look and feel of the interface, as well as set up rules and tasks that automate certain processes. Additionally, Outlook offers various features that allow users to organize their inboxes more efficiently and quickly access important messages. With its many customization options, Outlook can help you optimize your workflow and increase productivity.
To customize Outlook, users can modify their display settings, such as color schemes and themes. Additionally, Outlook allows users to change their view options by setting up filters or creating categories for grouping emails together. Users can also create rules that organize messages based on certain criteria and trigger tasks when certain conditions are met. Additionally, Outlook allows users to customize their quick access toolbar by adding frequently used commands.
By taking advantage of the customization options available in Microsoft Outlook, you can make the software work best for you. With its many customization options, Outlook offers an excellent solution for managing emails and boosting productivity.
Microsoft Outlook Automatic Email Management Features
Microsoft Outlook offers a range of automatic email management features that allow users to better organize their inboxes and enhance productivity. These features include Clutter, which moves lower priority emails into a separate folder; Focused Inbox, which separates important emails from the rest; Conversation View, which organizes related emails into one message thread; Quick Steps, allowing users to create customized rules for moving emails; and Rules and Alerts, which can be used to create automatic responses or forward messages. Additionally, the Quick Filter feature can be used to quickly view specific types of emails based on sender, subject line, date received and more.
All of these features are designed to help users better manage their email inboxes and make efficient use of their time. By leveraging Microsoft Outlook's automatic email management features, users can save time and increase productivity by effectively managing their inboxes.
Microsoft PowerPoint Basic Skills

Microsoft PowerPoint is an essential tool for the modern workplace, allowing professionals to create visually engaging presentations that are capable of conveying complex information. It provides businesses with the potential to make data more accessible and understandable and can be used to optimize communication in a wide range of settings. With the right skills, PowerPoint can be used to create powerful presentations that will effectively communicate ideas, data, or concepts to any audience.
Learn the skills below in our Microsoft PowerPoint - Level 1 or Microsoft PowerPoint Combo courses:
Interface Layout Basics of PowerPoint
When creating a PowerPoint presentation, there are several interface layout basics that you should be aware of. The first is the Slide Pane. This pane allows you to see thumbnails of all your slides in one place, and easily manage them by dragging and dropping their order. You can also access the master slide view from here by clicking on the ‘Slide Master’ button in the ribbon at the top of the window. This is important if you want to change the overall look and feel of your slides.
Next is the Notes Pane, which can be opened either by clicking on ‘View’ or by pressing Ctrl+Shift+N. In this pane, you can add extra notes and instructions for your presentation, which won’t be seen by anyone else. This is useful if you want to remind yourself of certain points or actions that need to be taken during the presentation.
Finally, there are the Slide Sorter and Outline Views. The Slide Sorter allows you to quickly rearrange slides by dragging and dropping, while the Outline View lets you see all the slides at once and rearrange them quickly. This is great for getting an overview of your presentation before you start adding content.
By understanding these interface layout basics in PowerPoint, you’ll be able to create presentations that are visually appealing and organized. With the right tools and knowledge, you’ll be able to create professional presentations that will wow your audience. With the help of PowerPoint, you can take your presentations to the next level.
PowerPoint Presentation Creation and Management
PowerPoint presentation creation and management is the process of creating and managing presentations with the help of Microsoft PowerPoint. It includes activities such as designing slides, organizing content, adding transitions and animations to slides, formatting text and images, and sharing the finished presentation. With its vast array of features, this software can be used to create professional-looking presentations for both personal and business purposes. It can also be used to store and share information, as well as track changes and collaborate with other users on a presentation. With the help of PowerPoint, you can ensure that your presentations look professional and persuasive, making them effective tools for communicating with any audience. Additionally, PowerPoint provides powerful tools for managing and organizing presentation content, so you can quickly update and make changes to your presentations. By taking advantage of these features, you can save time and effort when creating and managing presentations.
With its vast array of features, PowerPoint is an essential tool for creating successful presentations. By mastering the art of PowerPoint presentation creation and management, you can create powerful, persuasive presentations that will capture your audience’s attention. With its user-friendly interface and helpful features, PowerPoint can help you create presentations quickly and easily, making it a valuable asset for any business.
PowerPoint Slide Creation and Management
PowerPoint slide creation and management is the process of developing multimedia presentations that are visually engaging, organized, and effective. It involves creating slides with text, graphics, images, animations, audio clips, and video clips. The slides must then be managed by organizing them into a logical sequence and adjusting or adding elements to create an impactful presentation. PowerPoint requires an understanding of various design principles, such as composition, balance, contrast, harmony, and unity. It is important to create slides that are visually appealing, organized, and informative. In addition, the presentation must be supported by a clear script or storyboard outlining objectives and key messages. With proper PowerPoint slide creation and management techniques, you can create interactive and engaging presentations that will capture the attention of your audience.
PowerPoint can help to streamline projects and save time and money while creating strong messages that grab the attention of your viewers. Knowing how to effectively manage and create PowerPoint slides can increase engagement with audiences and result in more successful presentations.
PowerPoint Slide Text Editing Functions
PowerPoint slide text editing functions give users the ability to quickly modify and customize their presentations. With a few simple clicks, you can the font, size, color, and alignment of your text. You can also insert images and clip art to enhance your slides. Additionally, some versions offer more advanced features like spell checkers, animation effects, and transitions. This helps to ensure that your presentation is visually engaging and makes an impactful impression. With these features, users can create a professional-looking presentation in no time at all.
No matter what type of presentation you're creating, the text editing functions in PowerPoint provide you with the necessary tools to create an effective and engaging experience for your audience. With a little time and effort, you can ensure that your slides are professional-looking and easy to read.
PowerPoint Graphics Features
PowerPoint graphics features allow users to create visually appealing presentations that make their messages stand out. With a range of customizable options, users can choose from text boxes, clip art, SmartArt diagrams, charts and graphs, shapes, and line drawings. These elements can be added to slides independently or combined with slide backgrounds. Additionally, PowerPoint offers image editing tools such as the Picture Tools Format tab, which allows users to crop images and adjust brightness, contrast, and color saturation. Furthermore, PowerPoint's animation features enable users to add movement to their slides to draw attention to particular elements of a presentation. Overall, these graphics features help create professional-looking presentations that are sure to impress an audience.
PowerPoint Presentation Review and Finalization
PowerPoint Presentation Review and Finalization is a critical step in the presentation design process. It is the process of analyzing, improving, and editing content to create an effective presentation that meets audience expectations. This stage includes reviewing topics, structure, and visual elements such as fonts and colors, images, animations, and transitions. After review and finalization, the presentation can be delivered to the audience with confidence. The review and finalization process is essential for ensuring that the message is communicated effectively and that the presentation looks professional. It also helps to ensure the accuracy of content, as well as maintain consistency in design elements. With careful review and editing, a PowerPoint Presentation can be an effective tool for conveying information. It can help to engage an audience and create a memorable experience.
By ensuring that the presentation is well-crafted and polished, it will be more likely to make an impact on viewers. Thus, the review and finalization of PowerPoint presentations should not be overlooked in the presentation design process. Properly reviewing and finalizing presentations helps ensure accuracy, effectiveness, and professionalism. It is essential for creating presentations that deliver the desired results.
Microsoft PowerPoint Advanced Skills
Microsoft PowerPoint is an essential tool for many business professionals as it provides the ability to create compelling presentations to help promote ideas, products, and services. For individuals in various roles, from salespeople to executives, having advanced skills in Microsoft PowerPoint can be beneficial. Advanced skills with Microsoft PowerPoint can demonstrate a person’s expertise and capabilities to potential employers, clients, or colleagues. Using the various functions within Microsoft PowerPoint can help create interactive presentations that capture an audience's attention and effectively concisely convey ideas.
Learn the skills below in our Microsoft PowerPoint - Level 2 or Microsoft PowerPoint Combo courses:
PowerPoint Text Tables
PowerPoint text tables are a great way to present data or information. They provide an organized layout and help structure the presentation in a clear, concise manner. Unlike regular tables, PowerPoint text tables do not have any formatting options such as row and column heights, font sizes, or cell backgrounds. The content of the table is limited to plain text, making it easier to focus on the important information. PowerPoint text tables are also a great way to quickly compare and contrast different pieces of data, as well as make numerical comparisons visually engaging. With their simple design and emphasis on content rather than formatting, PowerPoint text tables can be a powerful visual tool in any presentation.
Are PowerPoint Business Graphics
PowerPoint business graphics are visual elements that can be incorporated into a presentation to enhance its overall aesthetic. This type of graphic includes charts, diagrams, tables, and images. These visuals help viewers understand complex data more quickly and efficiently and support the story being told. They also lend an element of professionalism to your slideshow and make it easier for your audience to remember the information. With PowerPoint business graphics, you can easily convey ideas and concepts effectively and engagingly.
PowerPoint business graphics come in all shapes and sizes. Charts allow you to compare data points or illustrate relationships between variables. Diagrams are great for illustrating processes or displaying hierarchical relationships between entities. Tables provide an effective way to present numerical information in an organized format. And images can be used to capture the attention of your viewers and illustrate a point more clearly.
No matter what type of business graphic you choose, it should always be relevant to the message you are trying to convey. The right visuals can make a huge difference in how well your audience comprehends your message, so it’s important to choose ones that are impactful and reinforce your point. When used correctly, PowerPoint business graphics can help you deliver an engaging and effective presentation that leaves a lasting impression on your viewers.
Sounds and Movements in PowerPoint
Sounds and movements in PowerPoint allow you to add audio and animation elements to your slides. Sounds can be used to indicate transitions between slides, as well as indicate important points or cues for the audience. Movements can provide emphasis and visual interest through animation effects that move objects around on the slide. Both sounds and movements can be added manually, or you can choose from pre-made audio and animation effects. Adding sound and movement to PowerPoint presentations can help increase engagement, so it’s worth considering when creating slides for your next presentation. When used properly, sounds and movements can add an extra level of interest and professionalism to your presentation. However, it is important to be mindful not to overdo it. Too many sounds and movements can be distracting, so consider carefully the message you are trying to convey before adding them.
When adding sound or movement effects to a presentation, keep in mind any special considerations such as the size of your audience and their preferences. For example, if there’s a large crowd, you may need to adjust the volume of your audio or choose less-intrusive animation effects. Additionally, you may want to consider the context in which your presentation will be viewed, as certain sounds and movements may not be appropriate for all audiences.
Overall, sound and movement effects can add an extra level of professionalism and visual interest to a PowerPoint presentation. When used properly and in the right context, these effects can be an effective way to make your presentation more engaging. Just remember to use them judiciously so that they don't distract from your main message.
PowerPoint Presentation Preparation and Delivery
PowerPoint presentation preparation and delivery involve creating slide decks that effectively communicate ideas, information, and stories. Presenters need to be aware of their audience and the context in which they are presenting. Presenters should know how to structure their slides, the visual elements they can use, what language to employ, and other effective techniques that will help them deliver their message effectively. It is also important to ensure that the presentation has good flow and pacing, as well as a logical progression toward the conclusion. Finally, presenters need to practice before delivering the PowerPoint presentation to be comfortable with the material and confident in delivery. With proper preparation and delivery, PowerPoint presentations can be a powerful tool to communicate ideas.
PowerPoint Efficiency Functions
PowerPoint efficiency techniques involve utilizing the available features of PowerPoint to create effective and engaging presentations. By becoming familiar with how to best use these features, you can maximize your chances of delivering an impactful presentation that resonates with your audience. From creating custom templates to introducing animations and interactive elements, there are several ways you can save time and energy when creating a PowerPoint presentation.
For example, if you’re repeating the same design elements on each slide, you can create custom templates that have pre-defined formatting and graphics. This way, instead of manually selecting font styles and colors for each slide, you can quickly apply the template to save time. Additionally, using animations and transitions helps break up the monotony of a slideshow presentation, keeping your audience engaged and interested.
Finally, introducing interactive elements to your slides can also enhance their presentation value. Features such as hyperlinks, video clips, and audio recordings add an extra layer of information for viewers to explore with just a few clicks or taps.
By leveraging the available features of PowerPoint, you can create more engaging presentations in less time. By taking a few extra steps to personalize your slides and incorporate interactive elements, you can help ensure that your message resonates with audiences. With these PowerPoint efficiency techniques, you’ll be able to deliver vibrant and impactful presentations with greater ease.
PowerPoint Custom Presentation Elements
Custom presentation elements can help you to stand out from the crowd and make a great impression on your audience. They can be tailored to fit your brand, theme, or message and offer an extra level of professionalism to your slides. Such elements could include custom fonts, unique images, graphics, logos, and animations. These are used in combination with text, photos, and videos to create an engaging presentation that will resonate with your audience. Using these custom elements can help you to grab attention and make a lasting impact, without compromising the overall look of your slides. This can be an invaluable tool for businesses looking to present their ideas in a visually appealing way.
Creating compelling presentations requires more than just knowledge of PowerPoint. Having the ability to customize your presentation elements can give you an extra edge in communicating important messages and ideas to your audience. By utilizing custom presentation elements, you can create a distinct look that will make your slides stand out from the rest. Quality visuals and graphics can be used to enhance any message or theme and will leave a lasting impression on your audience.
PowerPoint Saving and Sharing Options
PowerPoint offers a wide range of saving and sharing options, allowing users to access their presentations on different devices and platforms. Files can be saved locally, to the cloud, or exported in various formats.
When saving a PowerPoint presentation, users can choose from two primary methods: saving it as a PowerPoint file or selecting one of several different file formats. A PowerPoint file preserves all formatting, animations, and transitions in the presentation while other files may lose some features when converted. Commonly used options include PDF, JPG, MP4, and PPTX.
Sharing a PowerPoint with colleagues is also simple with cloud-sharing tools such as Google Drive and Dropbox. Presentations can be shared via link or email and automatically updates any changes made to the original file.
For added security, users can also password-protect their PowerPoint presentations. This ensures that only authorized individuals have access to the presentation and its content. Additionally, PowerPoint presentations can be published on a website for extended reach and collaboration opportunities.
Overall, PowerPoint provides an intuitive and comprehensive platform for saving and sharing presentations quickly and securely. Whether users are looking to save on their local machine, the cloud, or somewhere else entirely, they have a variety of options available to them.
Microsoft Project Basic Skills

Microsoft Project is a powerful tool project managers and teams use to help organize and manage complex projects. It enables users to plan, track and report on all aspects of their projects. Having basic skills in Microsoft Project can help ensure the success of any project. Creating a project plan within the application properly can save time in the planning process. Microsoft Project allows users to easily track project progress, budget, and resource allocation, and plan for upcoming tasks. Knowing how to effectively use these features can help ensure that resources are being properly utilized and that goals can be met in a timely manner.
Learn the skills below in our Microsoft Project - Level 1 or Microsoft Project Combo courses:
Microsoft Project Interface Layout
The Microsoft Project interface layout provides an intuitive and organized workspace for managing projects. The user interface is divided into 4 main sections - a Ribbon containing tabs of commands, the Timeline view, the Gantt Chart view, and the Task Details pane. The Ribbon contains all the tasks that can be used to create and manage projects, such as creating a new project, adding tasks and resources, setting up dependencies between tasks, assigning work to team members, and tracking progress. The Timeline view provides a graphical representation of the project timeline, with tasks presented in chronological order. The Gantt Chart view shows a graphical representation of the project plan with task start dates and duration bars. Finally, the Task Details pane gives users access to detailed information about each task, such as the name, duration, start date, and resources assigned. By using this intuitive interface layout, project managers can easily track their projects and make changes as needed.
This comprehensive view of the project plan enables project managers to be proactive in monitoring progress and making timely adjustments to ensure successful project outcomes. The Microsoft Project interface also provides powerful tools that enable users to optimize their resources, track project costs and analyze data. With the help of these features, project managers can ensure efficient utilization of their teams’ time and cost-effectively manage their projects. By using the Microsoft Project interface, project managers have the power to effectively plan for and track the progress of their projects.
Microsoft Project Plan
A Microsoft Project plan is a powerful tool for project management, resulting in successful outcomes. It allows users to plan the different stages of a project from start to finish, assign tasks and resources to team members, and track progress over time. By using this program, teams can manage their projects more efficiently, optimizing results while reducing costs.
Microsoft Project Plans offer a range of features that help teams to organize and monitor their projects, enabling them to stay on track and deliver successful results. These features include project scheduling and tracking, task management, resource assignment and tracking, timeline creation, reporting, and analytics. Microsoft Project plans also provide sophisticated data visualization tools that allow users to analyze their data in meaningful ways and quickly identify trends.
With the ability to easily track progress, assign tasks and resources, create timelines, and analyze data all in one place, Microsoft Project plans help project teams stay organized and ensure the successful completion of projects. By using this powerful tool, teams can be more productive and efficient in managing their projects, resulting in better outcomes for the organization.
Microsoft Project Task List
A Microsoft Project task list is a comprehensive list of tasks required to complete a project. It is used to break down a large project into smaller, more manageable parts and helps to organize the various steps needed for completion. The task list typically includes details such as the assignee’s name, start/end dates, duration estimates, predecessors, and any other relevant information. It is essential in helping to organize a project and ensure that all tasks are completed on time. By using Microsoft Project's task list feature, you can easily keep track of the progress of a project, identify potential issues before they become an issue, and make any necessary adjustments. With the help of your task list, you can ensure that your project runs smoothly and meets your goals.
Microsoft Project Resources
Microsoft Project resources are a set of tools and features that provide project managers with the ability to track, manage and report on projects in an organized and efficient manner. These resources give project managers the power to assign tasks, plan activities, measure progress, analyze data, and manage budgets. By taking advantage of Microsoft Project’s built-in features and capabilities, project managers can maximize the success and efficiency of their projects. Microsoft Project resources are a cornerstone for effective project management, helping to manage all aspects of a project from planning to implementation. They enable project managers to keep track of budgets, milestones, timelines, and other important details while ensuring that all tasks remain on schedule and within budget. Additionally, these resources provide project managers with the ability to monitor progress, analyze performance data, and forecast outcomes. Microsoft Project’s intuitive interface makes it easy to use and navigate, making it an invaluable asset for any project manager. With its wide range of features and capabilities, Microsoft Project resources are essential for successful and efficient project management.
Microsoft Project Resource Assignment to Tasks
Microsoft Project resource assignment to tasks is the process of allocating resources to specific tasks within a project plan. This can be done on an individual basis or by assigning different roles to groups of individuals, such as contractors and experts. An effective resource allocation ensures that everyone involved in the project knows their role and contributes to the success of the project. It also helps in controlling costs and ensuring that tasks are completed on time. Resource assignment can be done manually, using the project management software, or through third-party services. Once allocated, resources can be monitored and tracked to ensure they remain available throughout the project duration. A successful resource assignment is an essential part of any successful project plan and should be regularly reviewed and updated to ensure it is as effective as possible.
Understanding the needs of your project and accurately assigning resources will help you complete tasks on time, control costs, and meet expectations. It is important to consider the skills, capabilities, and availability of resources when planning a project so that the right people are assigned to each task. Proper resource assignment additionally helps to ensure that tasks are completed efficiently and without any unnecessary delays. To maximize the effectiveness of resource assignments, it is important to regularly monitor resource utilization and take into account any changes in availability or skill levels during the project. By doing so, you can make sure that resources are used effectively and that your project remains on track.
Microsoft Project Plan Formatting and Sharing
Microsoft Project plan helps you get organized and plan projects efficiently. It features a flexible formatting system that allows users to customize their plans according to their needs. The template library includes templates for project management, tracking progress, presenting data visually, and even handling resource conflicts. Once a user has created and saved a project plan, they can then share it with designated viewers, allowing for collaboration and easy editing. Team members can then access the plan from any device and easily make updates in real-time. Microsoft Project plan also features cloud-based storage capabilities, which enable users to securely store and share project plans with other team members. With these features, teams can work together efficiently and ensure that everyone is informed about the latest project updates. Microsoft Project plan makes it easy for teams to collaborate, remain on track and stay organized throughout any project.
Microsoft Project Progress Tracking
Microsoft Project progress tracking is a feature of Microsoft Project that provides the capability to visualize, monitor, and measure project progress. It enables project managers to effectively track and report on multiple projects in one place. The tracking feature allows users to compare actual versus planned performance metrics for each task or milestone associated with a project, so they can make informed decisions about the project. Through the tracking feature, project managers can quickly identify potential issues and take corrective action if needed. Additionally, the tracking feature allows users to visualize the progress of each task on a timeline or Gantt chart, making it easier to understand how far along a project is and where any potential delays may be occurring. Ultimately, Microsoft Project's progress tracking feature enables project managers to make proactive decisions that drive successful project outcomes.
By leveraging the progress tracking feature, project managers can easily compare their progress against the original plan, identify any delays or issues, and take action to ensure their projects are on track for success. With Microsoft Project's tracking feature, users can also monitor task dependencies, identify potential risks and take preventive measures to prevent any problems from occurring. Finally, Microsoft Project's reporting capabilities make it easy for project managers to easily present their progress in a visually appealing manner that allows stakeholders to understand the current status of the project quickly and accurately. This enables them to make informed decisions about how best to move forward with the project.
Microsoft Project Format and Print Views
Microsoft Project offers a variety of format and print views that allow you to customize how your project is presented. The four main types of Format and Print views are Gantt Chart, Calendar, Network Diagram, and Task Usage. Each view serves a different purpose, providing users with the appropriate information for their particular needs.
The Gantt Chart view is the most commonly used and provides a graphical representation of task duration, allowing users to easily monitor progress. The Calendar view provides an even more detailed view of tasks in terms of how they interact with each other as well as their deadlines. The Network Diagram view displays task dependencies and connections between tasks, while the Task Usage view provides a better understanding of resource allocation within the project.
Ultimately, these views allow for greater control over your project and help you quickly understand where tasks are at in the timeline. Utilizing these format and print views to their full potential will give you a clearer picture of how each task fits into your overall plan, allowing for more effective management and execution.
Additionally, Project's format and print views also allow for customizing the look of your project plan. You're able to control the font size, text alignment, color scheme, gridlines, and more to create a presentation that best suits your needs. For example, if you need a highly-detailed view with several dates and fields, you can adjust the view to show everything in an organized manner. Conversely, if you need a simpler view with a few basic details, you can customize the look of your project to present only what's necessary.
Format and print views are some of the most powerful features within Microsoft Project and can help project managers successfully deliver their projects. With the ability to customize views and understand the timeline of tasks, project managers can plan and execute their projects more effectively.
Microsoft Project Report Formatting
Microsoft Project report formatting is the process of creating a presentation-ready version of project results. This involves taking data generated by Microsoft Project and translating it into a format that is visually appealing and easy to read, with all important information presented. The goal of project report formatting is to provide an accurate summary of the project's progress, budget, timeline, deliverables, risks, and more. It should be an accessible document that stakeholders can easily understand, which allows them to make informed decisions about the project's future direction. By using Microsoft Project report formatting techniques, teams can share information in a way that is comprehensive yet concise. This ensures that stakeholders have all of the essential data they need to make informed decisions about the project's progress and future.
Microsoft Project Customization Options
Microsoft Project customization options give users the freedom to tailor their project management experience and adapt it to their own unique needs. With options to customize views, filters, and reports, users can gain invaluable insights into their projects quickly and efficiently. The following are some of the many Microsoft Project customization options available:
- 1. Custom Formats – Change the layout of elements in any view or table to organize project information more clearly.
- 2. Filters – Create and save custom filters to quickly find specific tasks, resources, or assignments while hiding irrelevant data and streamlining your view.
- 3. Groups – Group related tasks together and customize the structure of your project hierarchy with custom groups.
- 4. Custom Fields – Create custom fields to track project data that is unique to your organization and use it in calculations or reports.
- 5. Visual Reports – Use the visual report feature to create easy-to-understand graphical representations of project information, such as timelines, cost trends, and resource allocations.
- 6. Macros – Automate processes and reduce the amount of time spent on mundane activities with macros.
By taking advantage of Microsoft Project customization options, users can create an efficient and powerful project management experience that is tailored to their specific needs. With these options, users can quickly get the information they need to make informed decisions.
Microsoft Project Advanced Skills
Microsoft Project is a powerful project management software that helps teams plan and organize their projects to ensure successful completion. Advanced skills in Microsoft Project can help organizations improve efficiency, maximize resources, better manage time, and ultimately boost team productivity.
Learn the skills below in our Microsoft Project - Level 2 or Microsoft Project Combo courses:
Microsoft Project Task Scheduling Techniques
Task scheduling techniques are important for many industries, and Microsoft Project is a popular program that can be used to help manage projects. The goal of task scheduling is to determine how tasks need to be done within a certain amount of time. With the help of Microsoft Project, users can create schedules, assign resources and track progress in an efficient manner.
Task scheduling techniques used in Microsoft Project involve the use of calendars, dependencies, and constraints. Calendars help users set specific days on which tasks need to be completed. Dependencies are also important as they help determine which tasks must be done before others can start. Constraints are also vital for project management and help define when a task needs to start or be completed.
Using Microsoft Project, users can also create a Gantt chart that visualizes task scheduling and enables users to see how tasks need to be done and when they will be finished. The software also allows users to manage resources more efficiently by assigning resources such as workers or materials to specific tasks.
Overall, task scheduling techniques are essential for successful project management and Microsoft Project provides users with the tools they need to create schedules, assign resources and track progress. With these features, users can ensure that tasks are completed on time and that resources are used wisely.
Microsoft Project Task Detailing Techniques
Microsoft Project offers various techniques for detailing tasks in a project. Some of these techniques include breaking down large tasks into smaller ones, using templates to help create tasks more quickly and efficiently, assigning task owners to ensure accountability, setting deadlines and milestones to keep the project on track, and creating dependencies between related tasks.
By breaking down larger tasks into smaller ones, a project manager can gain a better understanding of the details and order in which tasks must be completed. This can also help identify any potential risks or problems that may arise before they become an issue. Additionally, using templates to create tasks can save time and effort by eliminating the need to manually enter information each time a task is created.
Task owners provide accountability by assigning an individual to a task. This ensures that someone is taking responsibility for the completion of the task and can be held accountable if it is not completed or done correctly. Setting deadlines and milestones help keep the project on track while creating dependencies between related tasks allows tasks to be managed more effectively by ensuring they are completed in the correct order.
By utilizing Microsoft Project task detailing techniques, project managers can ensure their projects are completed on time and remain organized. This helps to reduce stress and maximize productivity, leading to better results for all involved. By taking the time to plan out each step of a project before it begins, progress can be monitored without interruption, and potential risks can be identified before they become a problem.
Microsoft Project Resource and Assignment Techniques
Microsoft Project resource and assignment techniques enable businesses to manage their projects efficiently. This involves assigning resources, setting deadlines, tracking progress, and monitoring budgets. By using these techniques, project teams can ensure that the project is completed on time and within budget.
The first step to effective resource management is allocating resources correctly. This involves assigning the right people to the right tasks. It is important to have a clear understanding of the skills and availability of each team member, as this will ensure that they are given tasks that they can handle successfully. After allocating resources, it is also necessary to assign deadlines for each task. This helps keep teams on track and ensures that tasks are completed on time.
Once resources have been assigned and deadlines set, the project team can begin tracking progress. Using Microsoft Project's dashboard view, project managers can quickly identify areas where tasks are lagging or have fallen behind schedule. This enables teams to take corrective action if needed, ensuring that projects stay on track and finish within the allocated timeframe.
Finally, Microsoft Project's budgeting features enable teams to accurately track costs associated with the project. This provides a clear overview of how much has been spent and how close the project is to its budget goal. With this information, managers can identify any potential budget overruns before they become an issue, and make changes if needed.
Microsoft Project resource and assignment techniques provide project teams with the tools they need to complete projects efficiently. With a clear understanding of resources, deadlines, progress tracking, and budgeting, teams can ensure that their projects are delivered on time and within budget.
Microsoft Project Project Plan Techniques
Microsoft Project is a powerful tool for planning any project, from small, local initiatives to large-scale enterprise efforts. It allows users to create schedules and track tasks, resources, costs, and progress in real-time. With Microsoft Project's help, project managers can better manage their projects by creating detailed plans that identify activities, assign resources and estimate costs. Project plans created with the help of Microsoft Project can be used to communicate project progress and business goals to stakeholders, ensuring that all relevant parties are on the same page.
There are several techniques associated with creating a successful project plan in Microsoft Project. The first is to clearly define the scope of the project, which involves setting measurable goals and objectives that will guide the project's development. Additionally, it is important to develop a step-by-step plan of tasks and activities that need to be completed to achieve these goals. It is also important to consider allocating resources such as personnel, materials, and equipment so that each task can be completed on time. Finally, Microsoft Project allows users to track the progress of their project plan and adjust it as needed to ensure that all milestones are completed on time. With these techniques, project managers can maximize the effectiveness of Microsoft Project for planning and managing their projects. By utilizing the powerful features of this tool, project managers can create successful plans and have confidence in achieving optimal results.
Microsoft Project Plan Organization Methods
Microsoft Project Plan organization methods are useful for formalizing the project management process, ensuring that tasks and objectives are accomplished efficiently. Projects can be structured according to various organizational principles such as a Work Breakdown Structure (WBS), Critical Path Method (CPM), or Gantt Chart. The WBS divides the project into smaller, manageable tasks that are sequenced hierarchically; the CPM identifies the sequence of tasks and their durations, as well as any task dependencies; and the Gantt Chart provides an easily recognizable visual representation of project activities and milestones. All three methods help to ensure that all aspects of a project are accounted for, allowing managers to track progress and allocate resources more effectively. In addition, Microsoft Project Plan helps organize the project by assigning tasks to individuals or groups of people, setting deadlines, and tracking milestones. This enables managers to stay on top of their project's progress and identify any issues or gaps in execution. By making use of Microsoft Project Plan organization methods, projects can be managed with greater efficiency and accuracy.
In summary, Microsoft Project Plan organization methods are powerful tools for streamlining the project management process. The WBS, CPM, and Gantt Chart provide a framework to structure projects according to various organizational principles while helping managers identify task dependencies and track progress more effectively. These methods also help managers assign tasks, set deadlines, and monitor milestones. By making use of Microsoft Project Plan organization methods, projects can be managed in a more organized and efficient manner.
Microsoft Project Progress Tracking Methods
Microsoft Project provides several methods of tracking progress that can be used to measure the performance and success of a project. Some of these methods include Earned Value Analysis, Task Progress Tracking, Resource Usage Tracking, Deliverable Status Update, Milestone Tracking, and Variance Analysis.
Earned Value Analysis (EVA) is a powerful way to evaluate project performance and progress. This method looks at the cost, schedule, and scope of a project to calculate its performance value. EVA can help identify areas in which cost overruns are occurring or where delivery dates are not being met.
Task Progress Tracking is a method for tracking the completion of individual tasks within a project. It helps to ensure that all tasks are completed on time and within budget. Task Progress Tracking can be done manually or through the use of software such as Microsoft Project.
Resource Usage Tracking is a way to monitor and measure the usage of resources in a project. This includes tracking how much time each resource has been allocated to a particular task, as well as how efficiently resources are being used.
Deliverable Status Update is a way to track the progress of deliverables within a project. This method focuses on the completion of individual deliverables and whether they are meeting their objectives. Deliverable Status Updates can help to identify any issues that need to be addressed to complete a project on time and within budget.
Milestone Tracking is a way to measure progress against key milestones in a project. This method helps to ensure that deadlines are being met and that there is an overall understanding of the project’s progress.
Variance Analysis is another powerful tool for tracking project performance. This method looks at how actual project results compare to planned results to identify any variances. Variance Analysis can be used to assess the overall success of a project and to identify areas for improvement.
By utilizing these methods, it is possible to ensure that projects are completed on time and within budget. A combination of these tracking methods can provide an accurate picture of project performance and enable managers to take corrective action when needed.
By combining these methods, it is possible to comprehensively monitor the progress of a project and ensure that all objectives are being met. Microsoft Project provides an easy-to-use suite of tools to help track progress on projects effectively, helping organizations improve their overall success rate.
Microsoft Project Viewing and Reporting Techniques
Microsoft Project offers a variety of viewing and reporting techniques that allow users to gain powerful insights from the data captured in their projects. Microsoft Project has a range of capabilities, including the ability to view project information in different views, create custom reports and analyze project performance with graphical tools.
Viewing is an integral part of any project because it gives users the ability to quickly assess project progress and identify areas of concern. Microsoft Project allows users to customize their view, so they can focus on certain elements of their project or adjust the information displayed. For example, Gantt views show a timeline of tasks and dependencies in graphical form while Task Usage views display task assignments by resource. There are also multiple ways to display information within each view, such as making use of filters and sorting.
Reporting is the process of summarizing project data into meaningful information that can be used for decision-making. Microsoft Project provides a variety of reporting techniques that allow users to customize reports and export them in different formats, such as XML or PDF. Reports can cover different aspects of a project, from resource utilization to progress and performance. The data can be displayed in tabular or graphical form, allowing users to analyze trends and quickly identify areas of improvement.
Overall, Microsoft Project's viewing and reporting techniques help users gain valuable insights into their projects. With the ability to create customized views and reports, users can quickly assess project performance and make informed decisions.
Microsoft Project Information Sharing Options
Microsoft Project information-sharing options enable users to collaborate on tasks in a secure environment. Users can exchange data and documents with colleagues, partners, team members, and clients. Microsoft Project provides the ability to share project plans, track progress, manage resources, and update schedules to ensure projects are completed on time and within budget.
The sharing options available in Microsoft Project include:
- Email integration to enable users to send and receive documents and data directly from Outlook.
- Web publishing which allows users to publish project plans to the web or an intranet, enabling team members and clients to access up-to-date information from any location.
- Task updates that can be sent to stakeholders on regular intervals, enabling them to stay informed of project progress and make adjustments as needed.
- Resource sharing which allows team members to access the same resources whether they are located in different offices or countries.
- Security settings that can be adapted according to user needs, allowing users to specify who can view, edit and delete information.
Microsoft Project's information-sharing options enable users to effectively collaborate on tasks and keep stakeholders informed of progress, helping them to deliver projects on time and within budget. By using Microsoft Project's robust sharing options, users can easily collaborate on tasks and ensure projects are delivered efficiently and effectively.
Microsoft Project Plan and Resource Consolidation
Microsoft Project plan and resource consolidation is a feature of Microsoft Project that enables users to create project plans more efficiently by bringing all the tasks, resources, and information into one place. This feature helps reduce redundant data entry while providing visibility into how resources are being used in each project. It also allows teams to quickly identify any potential resource or scheduling conflicts. With Microsoft Project plan and resource consolidation, users can create detailed project plans in a fraction of the time it would take to manually enter information into multiple separate applications or spreadsheets. This helps them save time and money while ensuring projects are tracked accurately and managed efficiently. Additionally, it gives teams greater visibility into their progress by providing real-time updates on the status of the project and resources, reducing the risk of costly delays or problems. With this feature, businesses can create detailed plans faster, ensure accuracy in all aspects of their planning and tracking processes, save time and money, and gain greater visibility into their project management efforts.
Microsoft Publisher Skills

Microsoft Publisher is a powerful desktop publishing tool that can be used to create high-quality digital documents and publications. It provides users with the ability to easily design, format, and publish content for multiple purposes such as brochures, newsletters, flyers, cards, and other documents. As an all-in-one desktop publishing program, Microsoft Publisher can help users to create professional-looking documents quickly and effectively.
Learn the skills below in our Microsoft Publisher course:
Microsoft Publisher Interface Layout
The Microsoft Publisher interface layout is designed to be user-friendly and intuitive so that users can quickly and easily produce professional-looking documents. The main window of the program provides access to a wide variety of design elements, including text, pictures, clip art, templates, and other graphical objects. Users can edit their documents with tools such as font formatting, paragraph styling, and page layout. A comprehensive library of design elements is available to help users create dynamic, attractive documents with ease. The program also includes a suite of tools that allow users to share their documents via email, over the internet, or through social media outlets. Microsoft Publisher makes it easy for users to create professional-looking publications quickly and easily.
Microsoft Publisher Content Features: Text, Pages, Pictures, Text Boxes, Building Blocks
Microsoft Publisher content features can be used to create visually engaging documents in quick and easy steps. Text boxes, for example, allow you to highlight important elements of the document or provide additional information about a topic. They also enable you to add text within the box, adjust its size and shape, and control its font size, color, style, and alignment. You can also add pictures to your documents, which can be used to illustrate key points or draw attention to a particular topic. Publisher's Building Blocks feature allows you to quickly create sophisticated document elements from predefined designs with ease, such as tables of contents, headers and footers, page numbers, sidebars, and more. Finally, Pages enable you to set up multiple page layouts, and duplicate content across different pages. With the variety of features available in Microsoft Publisher, you can create beautiful documents quickly and efficiently.
Microsoft Publisher Text and Paragraph Formatting Features
Microsoft Publisher has a wide range of features that allow users to format text and paragraphs according to their needs. These features include options for adjusting the font type, size, color, alignment, spacing, and indents. Additionally, users can add bullets or numbering to create lists, as well as set tabs to easily align elements within one line of text. Microsoft Publisher is also equipped with an auto-correct feature, which automatically corrects text as it is being typed. Finally, users can decide if the text should be justified, or hyphenated and how many columns they want on a page. These features make formatting text and paragraphs easier and more efficient for a variety of publishing needs.
Microsoft Publisher Text Management Functions: Editing, Tables, Symbols/Special Characters
Microsoft Publisher is an invaluable tool for designing and publishing documents, offering a wide range of text management functions.
Editing: Microsoft Publisher allows users to easily edit their text via its editing tools, such as cut and paste, spelling/grammar checking, font formatting (e.g., bold, italics), etc. It also allows users to quickly and easily search/replace words or phrases in the text, making it easier to make global changes.
Tables: Microsoft Publisher also enables users to create tables for organizing and presenting data more effectively. It makes it easy to adjust cell size and spacing, merge cells, add and delete columns and rows, format data with various formatting options, and add borders to cells.
Symbols/Special Characters: Microsoft Publisher also allows users to easily add symbols and special characters to their documents. The software provides a variety of symbol libraries (e.g., currency/math symbols, geometric shapes, arrows, etc.) that can be quickly added with just a few clicks. It also offers a range of special characters, such as bullets and emojis.
Overall, Microsoft Publisher provides an array of powerful text management functions that make it easy to organize and present data in a visually appealing way. These features help improve the readability and clarity of documents, making them more attractive to readers.
Microsoft Publisher Graphics Functions
Microsoft Publisher is a powerful desktop publishing tool that can help users create professional-looking documents quickly and easily. It includes a wide range of graphics functions to make it easier for users to combine image elements into eye-catching designs. From adding photos and clipart to creating custom shapes and text boxes, Microsoft Publisher offers users the tools they need to create stunning documents for home, business, or school.
Microsoft Publisher’s graphics functions include a wide range of tools to help users quickly and easily customize their documents. For example, the ‘Insert Picture’ tool allows users to add images from their computer or directly from a web search into their document. The ‘Clip Art’ tool helps users choose from a library of illustrations, photographs, and 3D images to add visual interest to their design. The ‘Shapes’ tool enables users to draw a variety of shapes such as circles, squares, and arrows directly onto the page. Finally, the ‘Text Boxes’ tool allows users to add text boxes of various sizes and font styles to their documents.
Microsoft Publisher’s graphics functions offer users the flexibility they need to create unique and professional-looking documents. With its wide range of tools, it enables users to quickly turn ideas into visually stunning designs that capture attention and make a lasting impression. Whether for business or pleasure, the graphics functions of Microsoft Publisher can help users create wonderful documents with ease.
Microsoft Publisher Sharing and Printing Features
Microsoft Publisher allows users to easily share and print documents through various features. One of the main methods Microsoft Publisher uses to share documents is by exporting them as PDF files. Exporting as a PDF ensures that documents look the same regardless of what type of device or operating system is being used to view them. Additionally, these PDF files can be secured with a password or digital signature if desired.
Microsoft Publisher also allows documents to be shared by email directly from the application. This makes it easy to quickly send documents without having to export them first. Documents can even be set up as an HTML page and uploaded directly to a website.
When it comes to printing, Microsoft Publisher offers options for customizing documents and printing multiple pages on one sheet of paper. Documents can be easily printed in a variety of sizes, such as letter or legal-sized paper, labels, and even CD/DVD covers. Microsoft Publisher also allows users to automatically create a table of contents from their document, ensuring it is easy to navigate through their work.
Microsoft SharePoint for End Users Skills

Microsoft SharePoint is an essential tool for end users that provides various features to enhance their workflows and make their job easier. Its easy-to-use user interface allows users to access files quickly, collaborate with colleagues, share documents, and keep track of projects. End users with the proper skill set can fully utilize SharePoint to streamline their productivity, increase collaboration, and reduce the time spent on routine tasks.
Learn the skills below in our Microsoft SharePoint for End Users course:
SharePoint Sites Layout and Navigation
SharePoint Sites provide an organized and user-friendly layout for easy navigation. The main components of the SharePoint Site layout consist of the site’s homepage, library folders, pages, and lists. The homepage serves as the entry point to your SharePoint environment. It provides a snapshot of all content stored within your site, including documents, images, and videos. Library folders contain all of the documents that are uploaded and shared within your site, providing a single location for users to access them. Pages enable users to create content on a single page and share it with other members of the site. Lists provide a way to structure data by creating columns for each item, allowing you to store information about different items in an organized manner. Navigation through the SharePoint environment is done with the Site Map, which displays all of the different sections within your site. With this structure, users can quickly find relevant information with ease. The navigation bar at the top of each page also provides quick access to library folders, pages, and lists located within a particular section. By understanding the layout and navigation of SharePoint Sites, you can quickly access the information or documents you need with ease.
SharePoint Lists and Libraries
SharePoint lists and libraries are containers for storing and managing digital information, such as documents, images, or other media. They provide users with an easy way to store, organize and share content within a SharePoint site. Lists can be used to store data in tabular format and support custom views, sorting, filtering, and aggregations. Libraries are used to store files or documents and can be configured with document versioning and content approval workflows. Both lists and libraries support metadata tagging which enables users to find related information quickly using filters or search queries. SharePoint also allows users to collaborate on content stored in a list or library by sharing links or creating workflows for approval. With SharePoint lists and libraries, users can quickly and easily access, store and share digital information securely.
SharePoint Search Functions
SharePoint search functions allow organizations to quickly find information from their document and data stores. With SharePoint, users can perform keyword searches of documents, libraries, lists, and other content types. Advanced search options are also available to refine results and improve accuracy. Using a combination of managed properties, query rules, and result sources enables users to create customized search experiences that meet the needs of their organization. SharePoint search functions are also integrated with popular third-party applications, such as Microsoft Office and Outlook, allowing users to access content from within these applications. In addition, SharePoint offers support for various languages and different formats; allowing users to quickly find documents across all global regions. As a result, organizations can benefit from improved productivity and better collaboration. With SharePoint search functions, users can find the documents and data they need quickly, enabling them to make informed decisions promptly. Ultimately, this leads to greater efficiency, cost savings, and better workflows. By utilizing these powerful search capabilities, organizations can unlock the full potential of their digital content. Therefore, organizations should consider investing in SharePoint search functions to maximize the value of their data and drive long-term success.
SharePoint My Site and OneDrive Features
SharePoint My Site and OneDrive are two of the most popular features of SharePoint. They both allow users to share, store and collaborate with others in their organization. My Site provides a private workspace for individuals where they can store work-related documents, tasks, contacts, conversations, and more. It also includes tools to help them stay connected with people in their organization and keep up to date with news and events.
OneDrive is a cloud-based file storage service that allows users to store, access, share and collaborate on documents from anywhere. It also provides tight integration with Office 365 for users to quickly create and edit documents online, then save them directly to their OneDrive.
These features make it easier for users to access their important work-related documents and collaborate with colleagues on projects from any device. By having quick and easy access to documents, SharePoint My Site and OneDrive enable more efficient working across organizations. It is also much more secure than email as files are stored in a secure environment and have enhanced security policies. Furthermore, administrators can control the permissions and access users have to different documents within their organization. This provides an extra layer of security and helps prevent unauthorized access or sharing of confidential data. By combining My Site and OneDrive features, users can create a powerful workspace that is both secure and efficient for collaborating with others in their organization.
SharePoint Webpages
SharePoint webpages provide businesses and organizations with a platform to create and manage their websites. These pages are dynamic, responsive, and highly customizable. With SharePoint, businesses can quickly create pages that have engaging graphics, videos, audio clips, surveys, polls, forms, and other interactive elements. Furthermore, these webpages are also built for collaboration, allowing multiple users to work together on a single project or webpage. SharePoint also offers advanced security features that are designed to keep your data safe and secure. With its web-based access and management capabilities, SharePoint webpages can help businesses improve their online presence, increase efficiency, and develop better client relationships. It has quickly become the go-to platform for businesses around the world that are looking to create reliable and engaging websites.
SharePoint Site Creation and Management Functions
SharePoint site creation and management functions are essential tools for any organization that needs to build, manage, and maintain an online presence. These functions allow users to quickly create sites with a range of custom options and features. Users can then manage the site by adding content, assigning permissions, making changes to page layouts, and more. The ability to easily create, manage and maintain site content ensures that businesses can keep their online presence up-to-date and engaging. Additionally, the use of SharePoint functions allows organizations to easily integrate the tools they need to collaborate on projects with members outside of their organization. With SharePoint's comprehensive suite of features, businesses have all the resources they need for a successful web presence.
SharePoint site creation and management functions also provide businesses with tools to help keep their data secure. With the ability to manage user access and assign permissions, organizations can ensure that sensitive information remains safe. Additionally, SharePoint allows users to back up their content regularly, which ensures that any vital records or files remain accessible in the event of a system failure.
Overall, SharePoint site creation and management functions are essential for businesses looking to establish and maintain an effective web presence. With its suite of features, organizations can easily create sites with custom options and manage their content to ensure that their online presence is up-to-date and secure. With SharePoint, businesses have all the tools they need to create a successful web presence.
SharePoint Wikis, Blogs, and Community Sites
SharePoint wikis, blogs, and community sites are web-based tools that enable users to collaborate in real-time. Wikis are sites for creating documents collaboratively, with the ability to quickly update information without having to go through a complex process. Blogs provide an easy way for teams of people to share thoughts, updates, and stories from their projects and everyday life. Community sites let members of a team or organization interact, post news and events, share resources, and give feedback on projects. All three tools can be used to create an effective collaboration platform that encourages communication between coworkers both inside and outside the organization. With SharePoint wikis, blogs, and community sites, businesses have access to an easy-to-use and robust communication platform that helps them stay connected and productive.
SharePoint Tasks
SharePoint tasks are the perfect tool for streamlining business processes, enabling businesses to manage projects more efficiently. With SharePoint tasks, businesses can create task lists and assign tasks to team members with due dates, so that progress can be tracked in real-time. It also offers easy collaboration between teams as they can easily share files and documents associated with the task, and keep track of project details. SharePoint also allows users to create custom views to filter tasks by status, assignee, or due date, allowing organizations to quickly identify any delays and manage their tasks more effectively. Thanks to its user-friendly interface, businesses can customize their tasks for better organization and collaboration, making it easier for teams to stay on track and complete tasks quickly. With SharePoint, businesses can easily manage multiple projects, ensuring that tasks are completed promptly with minimal effort.
SharePoint Workflows
SharePoint workflows are automated processes that allow users to manage and track tasks or documents in an organized way. They provide a structured, step-by-step approach for achieving a task or process, making it easier to identify bottlenecks and streamline operations. SharePoint workflows can be used for anything from bringing on new employees to approving a project budget. They are designed to not only automate tasks but also to ensure that the process runs smoothly and efficiently. SharePoint workflows can be used in combination with other features of the platform, such as document libraries and lists, to provide an efficient way for users to collaborate on projects and tasks. With SharePoint workflows, users can keep track of progress and ensure that everything is completed on time. They also help to reduce the amount of manual, time-consuming work needed to keep tasks moving forward.
SharePoint workflows are an invaluable tool for businesses seeking to optimize their processes and create a smoother workflow. Furthermore, they provide a secure environment where users can collaborate without fear of sensitive data being lost or compromised. With SharePoint workflows, businesses can get the most out of their resources and maximize efficiency.
SharePoint Microsoft Office Collaboration Features
SharePoint offers many collaboration features for use with Microsoft Office. This includes the ability to co-author documents, share and edit spreadsheets in real-time, post comments on documents and files, manage document versions, view shared calendars or task lists, and much more. By giving users access to these collaborative tools from within their web browser or mobile device, teams can stay connected and productive while on the go. SharePoint also provides other features to facilitate collaboration such as document sharing, file storage, forms creation, and project management tools. With these powerful tools in place, employees can quickly work together towards a common goal. Furthermore, the robust security measures built into SharePoint make it easy for administrators to keep all data safe and secure. With these features, SharePoint is an ideal choice for organizations that need efficient collaboration tools to maximize the productivity of their teams. By utilizing the power of SharePoint’s collaborative features with Microsoft Office, organizations can make sure their teams are working together more effectively than ever before.
SharePoint Business Intelligence (BI)
SharePoint Business Intelligence (BI) is a suite of Microsoft products and services designed to achieve greater organizational intelligence and performance. It includes features such as analytics, dashboards, scorecards, data visualization tools, reporting, collaboration tools, and more. SharePoint BI takes advantage of the enterprise capabilities of SharePoint Server to provide organizations with an integrated set of tools and services to access, analyze, and share data. It helps businesses improve their decision-making processes by providing them with valuable insights into their operations and enabling greater collaboration among teams. With SharePoint BI, organizations can gain a better understanding of the operational performance of their business, identify opportunities for improvement, and make more informed decisions that drive greater success.
SharePoint BI provides the tools and services to help organizations create a more intelligent enterprise, enabling them to increase efficiency, improve customer satisfaction, reduce costs, and generate greater profits. From managing finances and personnel resources to streamlining processes and identifying new markets, SharePoint BI can help businesses realize their full potential. With its powerful analytics and data visualization capabilities, SharePoint BI can help businesses better understand their operations, identify trends, and make more informed decisions. By utilizing the tools and services within SharePoint BI, organizations can gain greater insights into their performance and develop a competitive advantage in the marketplace.
SharePoint Management and Content Monitoring
SharePoint management and content monitoring is a service used to help businesses manage their SharePoint sites. It ensures that users have access to the right information, to maximize the efficiency of their workflows. It also helps maintain data security and integrity by ensuring that only authorized people have access to sensitive documents and data stored on SharePoint. Content monitoring involves the tracking of changes made to documents stored in SharePoint, enabling administrators to quickly identify any problems and take appropriate action. Additionally, SharePoint management and content monitoring can help ensure that all users are using the correct versions of documents and data stored within the system. This helps maintain up-to-date records and ensures compliance with policies and regulations. Finally, SharePoint management and content monitoring can help streamline the search process by providing better organization of documents and data stored in SharePoint. This enables users to quickly locate the information they need, saving time and effort.
Microsoft Office 365 Online (with Teams for the Desktop) Skills

Microsoft Office 365 Online with Teams skills are indispensable for businesses of all sizes. It allows employees to communicate and collaborate effectively and efficiently in real time. Teams provide features such as instant messaging, file sharing, audio and video conferencing, task management, and more to help groups and organizations increase productivity and collaboration. With Office 365 Online, teams can access documents from any device with an internet connection, allowing them to collaborate more efficiently anywhere.
Learn the skills below in our Microsoft Office 365 Online (with Teams for the Desktop) course:
Office 365 Shared File Collaboration
Office 365 shared file collaboration is a cloud-based file-sharing and collaboration solution that enables users to securely store, access, share, and collaborate on files from anywhere. It allows multiple users to work on documents at the same time in real time, without having to worry about version control or data loss. With Office 365 shared file collaboration, users can share files with other people inside or outside of the organization and control who has access to which documents. Collaboration tools such as commenting, editing, and annotation are also available so that teammates can stay on the same page. Office 365 shared file collaboration is an easy-to-use solution for keeping teams connected and productive, no matter where they are. With the secure file-sharing capabilities and collaboration tools, Office 365 shared file collaboration ensures that documents are always up to date and that team members can work together efficiently.
Office 365 Productivity Apps: Yammer, Planner
Yammer is a cloud-based workplace productivity tool that allows teams to collaborate on projects, tasks, and discussions in real-time. Yammer enables users to communicate more efficiently by creating conversations within their workspace, as well as publicly outside of it. It also offers features such as group chat, file sharing, polls, etc., which can help teams stay on the same page and make decisions faster.
Planner is a collaboration tool that helps users organize tasks, assign projects to members, track progress and deadlines, and easily share any changes with the team. It works in conjunction with Yammer so that users can take advantage of both features for maximum productivity. Planner allows teams to create and manage tasks, assign members to teams, and set deadlines. It also offers real-time notifications when changes are made so everyone can stay up-to-date on their projects. With Planner, teams can easily track progress and collaborate more effectively.
Collectively, Yammer and Planner provide users with an integrated platform that enables users to work more collaboratively and efficiently. With these tools, teams can track tasks, share files and conversations, assign deadlines, and keep up with the latest changes all in one place. By taking advantage of the Office 365 productivity apps, businesses can increase their efficiency and succeed in today’s fast-paced digital workplace.
Office 365 Outlook on the Web
Office 365 Outlook on the Web is a comprehensive set of web-based tools and services built to help users efficiently manage their email, contacts, appointments, and tasks. With Office 365 Outlook on the Web, you can easily collaborate with teams and access your emails from any device connected to the internet. It also features powerful organizational capabilities such as conversation view, message flags, and customizable folder structure. In addition to email, Office 365 Outlook on the Web includes many other features such as a calendar, contacts, and tasks that further enhance its productivity capabilities. With a range of powerful integrated services like Exchange Online, SharePoint, OneDrive for Business, Skype for Business, and Yammer, Office 365 Outlook on the Web offers a comprehensive solution for efficient workplace collaboration and productivity. Office 365 Outlook on the Web is a great way to easily collaborate with others, stay organized, and access information from anywhere.
Office 365 Teams Collaboration Features
Office 365 Teams is an online platform that helps teams in businesses to collaborate more efficiently and effectively. It provides a collaborative workspace with features such as chat, voice and video calling, and file sharing. Microsoft Teams also allows for the integration of other Office 365 applications such as Word, Excel, PowerPoint, SharePoint, and OneDrive, allowing team members to work together on documents in real time. Additionally, teams can add third-party applications and services to customize their workspace. With Office 365 Teams, team members can stay connected and informed wherever they are by using their laptop, tablet, or mobile phone. This makes it easier for teams to collaborate on projects with remote colleagues or partners across the globe. Office 365 Teams also provides users with a host of other collaboration features such as task management, scheduling, and conferencing tools. By using these features, teams can streamline their workflow, increase productivity and stay on top of projects.
Office 365 Teams Configuration: Teams, Channels, Tabs
Office 365 Teams Configuration is a platform used to support collaboration among remote teams. It’s made up of three key elements – Teams, Channels, and Tabs. Teams are the main workspace where people communicate and collaborate within an organization. A Team can be created around any topic or project, such as a marketing campaign or HR initiative. Each Team has its discussion board and document library, which can be used to store project files and notes. Channels are the sub-groups within a Team that focus on specific topics or tasks. For example, in a marketing Team, there may be channels for PR, advertising, and events. Within each channel are Tabs – custom pages that provide access to specific information and resources. For example, in a PR Channel, you may have tabs for press releases and media contacts. Office 365 Teams is designed to make teamwork more efficient, bringing all the necessary tools and information together in one place. Keeping everyone on the same page, helps remote teams stay productive and connected even when they’re not in the same physical space.
In addition to organizing content within Teams and Channels, Office 365 also provides ways to customize the experience. It supports the use of bots and connectors to help automate specific tasks or notifications, as well as emojis and GIFs to add some lighthearted fun. By tailoring the Teams platform to your business needs, you can create an environment that promotes collaboration and drives results.
Microsoft Visio Basic Skills
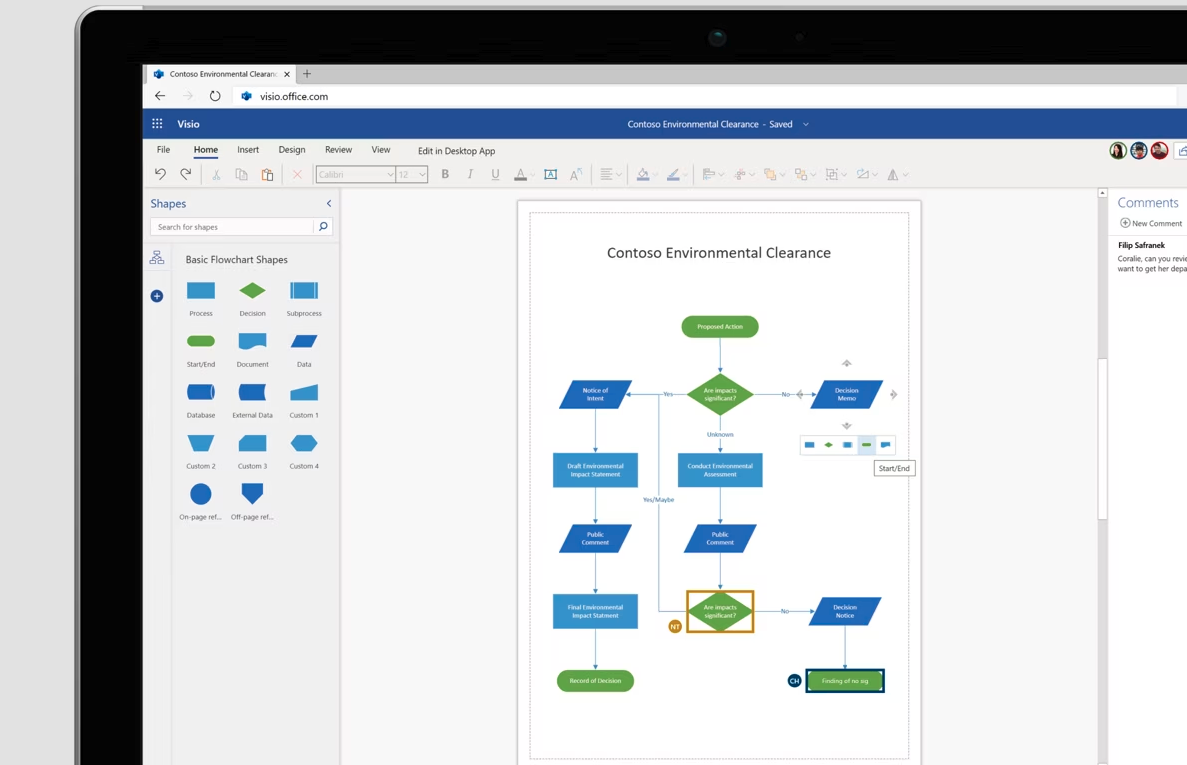
Microsoft Visio Basic skills have become increasingly important in the modern business world. By learning the basics of Visio, you can create detailed diagrams and flowcharts to help better explain complex processes or data flows within a business environment. These visuals are easier to understand and can be used as effective presentations for colleagues, customers, and other stakeholders. Visio can also quickly identify process problems and develop solutions to improve organizational efficiency. Overall, Microsoft Visio Basic skills are essential for anyone wanting to make an impact in their business environment. By mastering the basics of Visio, you will gain a valuable asset that can help advance your career.
Learn the skills below in our Microsoft Visio - Level 1 or Microsoft Visio Combo courses:
Microsoft Visio Interface Layout
Microsoft Visio is a powerful diagramming application that helps users create professional-looking diagrams and flowcharts. The interface layout makes it easy to access the various tools used for creating visuals. It has three main sections: the Shapes window, the Ribbon, and the Page area.
The Shapes window allows users to select the shapes and objects they want to use in their diagram. It includes presets for common diagrams like flowcharts, network diagrams, and UML diagrams. It also offers tools for customizing any shape or object.
The Ribbon at the top of the Visio window provides access to the various tools used for formatting, styling, and coloring shapes, as well as for customizing diagrams and saving them to different formats.
The Page area is where users can drag, drop, resize, and arrange all of the shapes they've chosen. The Page area has rulers, grids, guides, and other tools that help ensure accuracy in diagram creation. It also includes several layers so users can organize their diagrams into logical sections.
Visio's simple, organized interface layout makes it easy to quickly create professional-looking visuals for both personal and business use. The application provides users with all of the tools they need to craft custom diagrams and flowcharts that are tailored to their specific needs. With a few clicks, users can create beautiful visuals that help bring their ideas to life.
Microsoft Visio Diagrams
Microsoft Visio diagrams are a versatile way to present data, ideas, and concepts. They can be used for a variety of purposes from presenting business processes to illustrating intricate technical schematics. With pre-made templates and intuitive drag-and-drop tools, anyone can create professional-looking diagrams quickly and easily. Visio diagrams can incorporate text, shapes, and even images to create a comprehensive visualization of information. This allows viewers to comprehend complex ideas at a glance, making them an ideal choice for presentations or documents that require clear visuals. Visio diagrams can easily be shared via email or attached to other Microsoft Office products. With their versatile nature and easy-to-use design tools, Microsoft Visio diagrams are a powerful and effective way to communicate with colleagues, partners, and customers.
Microsoft Visio Shapes, Text, and Pages
Microsoft Visio shapes, text, and pages are the building blocks for creating meaningful diagrams in Visio. Shapes are the individual graphic elements that make up a diagram. Text is used to label or explain the items in a diagram. Pages provide a way to group related objects in one view. With these three tools, users can create compelling visuals that illustrate complex processes, relationships between entities, and the flow of data. Visio shapes can be customized to create a unique look for each diagram, allowing users to communicate their ideas in an impactful way. The text element is used to label the items in a diagram and explain their purpose. It can also be used to provide additional detail on the items in a diagram, making it easy for viewers to understand the information being presented. Finally, pages provide a way to organize related objects into one view, ensuring that all elements of the diagram are visible at once. Together, these three tools allow users to create diagrams with precision and accuracy which can help simplify complex ideas or processes.
Microsoft Visio Business Process Diagrams
Microsoft Visio business process diagrams are a powerful visual representation of business processes that enable organizations to better understand and manage their operations. These diagrams provide a graphical representation of the flow of steps, activities, and tasks that make up any business process. They can be used to identify potential areas for improvement and help clarify roles and responsibilities within an organization. Visualizations of this kind can also highlight inefficiencies, identify opportunities for automation, and help improve overall operational performance. Microsoft Visio diagrams are an essential tool for any organization looking to optimize its operations. With intuitive features and a simple drag-and-drop interface, Microsoft Visio makes it easy to create custom business process diagrams that provide valuable insight into how an organization operates. By integrating these diagrams into existing operations, organizations can effectively monitor and manage their business processes for improved performance. As such, Visio diagrams are essential for any organization looking to achieve process optimization.
Microsoft Visio Organization Charts
Microsoft Visio organization charts are a graphical representation of the structure of an organization, department, or team. They can be used to display roles, responsibilities, and relationships between different individuals in the organization. Visio’s shapes and layouts make it simple to construct an organizational chart that is both visually appealing and accurate. With Visio's built-in tools, you can easily customize your organization chart to fit the unique needs of your business. You can create detailed hierarchical charts that display reporting relationships or condensed flowcharts that quickly show the flow of tasks and decision-making authority. Visio’s flexibility makes it an ideal choice for creating a variety of organizational diagrams. From complex enterprise structures to simple departmental charts, Visio provides the features you need to capture your organization’s structure. With just a few clicks, you can create an organizational chart that will help you manage and communicate your organization’s relationships more effectively. Using Microsoft Visio for your organization charts helps ensure that everyone in the company understands the structure of the organization and its respective roles.
Microsoft Visio Styling, Color, and Themes
Microsoft Visio is a powerful diagramming application that helps business professionals and technical users visualize data, processes, relationships, and other information. It is known for its easy-to-use interface and wide range of features. Styling, colors, and themes play an important role in achieving a visually appealing presentation.
Styling options in Microsoft Visio include line thicknesses, effects, and arrow styles. Color palettes can be customized to create a consistent look and feel throughout the diagrams. There are several built-in themes available for quickly styling diagrams without having to adjust individual elements. Additionally, custom themes can be created that allow users to save their favorite color combinations for reuse on future diagrams.
The styling, colors, and themes in Microsoft Visio help to bring a professional look to any diagram. By utilizing these features, users can create visually appealing presentations that make it easier for their viewers to understand the data being presented. Additionally, the use of consistent colors and themes throughout a presentation makes it more memorable and aesthetically pleasing. With the right styling, colors, and themes, Microsoft Visio can help you create presentations that make an impact.
Microsoft Visio Printing, Reusing, and Sharing Features
Microsoft Visio is a powerful software program designed to help users create visuals to effectively express complex information. It offers several features that make it easier for users to print, reuse, and share their diagrams.
Printing capabilities in Microsoft Visio allow for the easy distribution of visual information in printed form. The user can customize the page layout to print diagrams in formats such as portrait, landscape, and multiple copies per page. Furthermore, the user can print a selection of shapes from a current diagram onto different paper sizes if needed.
Reusing capabilities enable users to avoid the lengthy process of recreating drawings for similar projects. Visio allows for the saving and loading of templates and saved drawings, making it easy for users to reuse their diagrams. Additionally, the user can store and re-use styles, color schemes, shapes, and other elements that are used often in diagrams for quick access.
Finally, sharing capabilities make it possible for users to share their Visio files with colleagues or others who may not have Visio installed on their computers. For example, the user can export diagrams to various formats such as .PNG and .PDF or as an image or web page, which can then be shared with other users. Additionally, they can upload their Visio file to a Microsoft SharePoint site to enable collaboration.
These features make Microsoft Visio printing, reusing, and sharing capabilities an invaluable resource for businesses requiring visuals to effectively represent their data. It provides users with the ability to quickly create diagrams that can then be shared or reused easily and conveniently. Therefore, Microsoft Visio is a must-have tool for any business looking to make the best use of its visual information.
Microsoft Visio Advanced Skills
Microsoft Visio Advanced skills are essential for creating high-quality graphical representations of data, processes, and information. They allow organizations to effectively communicate complex ideas, plans, and designs to stakeholders and customers quickly and easily. With Visio's visual representation, businesses can display how different systems interact, pinpoint areas of improvement within their organization, and develop strategies for improvement. A team of employees proficient in Microsoft Visio Advanced skills can help companies save time, money, and resources by providing visual clarity to their projects.
Learn the skills below in our Microsoft Visio - Level 2 or Microsoft Visio Combo courses:
Microsoft Visio Network and Datacenter Diagrams
Microsoft Visio network and data center diagrams are powerful visuals that enable users to accurately map out their networks, data centers, systems architecture, and other IT assets. These diagrams allow the user to easily identify potential weak points or bottlenecks in their infrastructure, as well as quickly spot any inconsistencies that may arise. Not only do these diagrams provide an invaluable asset for tracking and managing complex data, but they also allow the user to quickly identify areas of improvement or strengths that can be leveraged. Additionally, Visio Network and Datacenter Diagrams are often used to create graphical representations of existing and potential networks and data centers, allowing the user to better plan their network deployments and prepare for potential scenarios. With the help of these diagrams, users can easily optimize their networks to ensure peak performance and scalability for a wide range of applications. Ultimately, Microsoft Visio network and datacenter diagrams provide an invaluable tool to IT professionals who need to quickly identify any weak points or inconsistencies in their infrastructure and take proactive steps to ensure optimal performance.
Microsoft Visio Shape Data
Microsoft Visio shape data is a form of metadata that can be used to provide additional information and discrete values for a Visio shape or group of shapes. This data can be used to describe the properties of a shape or even provide an organizational structure for large diagrams. Additionally, shape data can be used to facilitate custom calculations, user input forms, and automation processes within a Visio drawing. It is important to note that shape data is only visible when editing a diagram; it does not appear in the actual view of a diagram. Shape data also does not affect the appearance or behavior of a selected shape, making it an ideal way to add custom metadata for shapes. By leveraging shape data, users can organize and quickly search their diagrams with keywords or categories, making them easier to understand and use. Visio shape data can be a powerful tool for improving efficiency and accuracy in the diagramming process.
Microsoft Visio Data Visualization Features
Microsoft Visio is a powerful data visualization tool that can be used to create diagrams and visuals that provide insight into complex datasets. With Visio, users can transform raw data into engaging visuals such as mind maps, organizational charts, flowcharts, Gantt charts, network diagrams, and more. The program's features allow users to customize their visuals to communicate data clearly and effectively. Visio also offers a wide range of templates, themes, and symbols to help users get started quickly. With its easy-to-use interface and powerful features, Microsoft Visio can help organizations insightfully visualize their complex data. It is the ideal tool for creating eye-catching presentations that are sure to engage and inform audiences. By leveraging Microsoft Visio, organizations can gain a deeper understanding of their data, allowing them to make better decisions and achieve greater success.
Visio's powerful features include:
- Quick Access Polls that allow users to quickly find insights from large datasets.
- The ability to create and share interactive diagrams.
- Templates, themes, and symbols to help users create professional visuals quickly.
- Dynamic data linking capabilities that enable real-time updates of visuals when new data is available.
- Easy integration with Microsoft Office applications such as Word, Excel, PowerPoint and OneNote.
- Automation tools that streamline the data visualization process and save time.
- Flexible design options that allow users to customize visuals to meet specific business needs.
- Tools for sharing visuals with colleagues, customers, and stakeholders.
Microsoft Visio is an ideal solution for organizations looking to make sense of their data in a visually appealing way. With its powerful data visualization capabilities, it can help users quickly gain insight into their datasets, enabling them to make better decisions and achieve greater success.
Microsoft Visio External Data Linking
Microsoft Visio external data linking allows users to include up-to-date, real-time information in their business diagrams and graphical representations. This feature makes the process of reporting, analyzing, and interpreting data easier than ever before. It also helps to streamline processes by eliminating redundant tasks. With Microsoft Visio external data linking, you can quickly and accurately link data from multiple sources, such as Microsoft Access, SQL Server, Oracle databases, and other sources. You can also use Visio to visualize and explore the relationships between different elements of your data. By linking external data with Visio diagrams, users can quickly identify patterns and trends in their data that would otherwise be difficult to see. With Visio's powerful data-linking capabilities, users can quickly generate meaningful insights and actionable plans that drive business decisions. Microsoft Visio external data linking is the perfect tool for anyone who wants to visualize their data in an easy-to-understand format. With this feature, you can quickly and easily create meaningful visualizations of your data, allowing you to make better decisions and more informed decisions faster.
Microsoft Visio external data linking is the perfect tool for any business analyst or data scientist who needs to quickly and accurately link their data with visualizations. With powerful capabilities and ease of use, Visio's external data linking makes it easy for anyone to create meaningful insights from their data.
Microsoft Visio Hyperlink Features
Microsoft Visio hyperlink features offer enhanced document navigation, making it easier to access important content. With the ability to link shapes, documents, and websites within a diagram, users can quickly jump to related diagrams and external resources with just one click. The Microsoft Visio Hyperlink feature is also customizable so users can tailor the look and feel of their links to match the overall visual design of their document. This capability allows users to make hyperlinks stand out while ensuring they remain focused on the data or information being conveyed. Additionally, Microsoft Visio supports a range of integrated tools that further enhance document navigation by allowing users to add text descriptions or images alongside their links. This valuable feature helps users provide more context for their diagrams and make it easier to find related content. Ultimately, the Microsoft Visio Hyperlink feature is a powerful tool that makes it easier for users to navigate through documents and access relevant content.
Structure Options For Diagrams in Microsoft Visio
Microsoft Visio offers a range of structure options for creating diagrams. These include flowchart, timeline, cross-functional flowchart, organization chart, business process model and notation (BPMN) diagram, network diagram, and swimlane diagram.
Flowcharts are useful for illustrating a sequence of steps or the different stages in a process, while timeline diagrams are ideal for visualizing the sequence of events. Cross-functional flowcharts provide a snapshot of how tasks and information flow across different parts of an organization, displaying the interdependence between them. Organization charts help to identify roles within an organization, as well as their relationships.
Business Process Model and Notation (BPMN) diagrams allow users to model the specific activities of a process, such as tasks and events. Network diagrams are used for illustrating how IT systems interact with each other and what components make up a network. Swimlane diagrams can be used to show who is responsible for various tasks or activities in a workflow.
Microsoft Visio provides an intuitive, user-friendly environment for creating and editing diagrams. The program’s powerful tools make it easy to customize each diagram according to the specific needs of a project. With Visio’s structure options, users can effectively visualize their data, helping to facilitate better understanding and more efficient decision-making.
Microsoft Visio Diagram Validation
Microsoft Visio Diagram Validation is a feature that allows users to quickly and effectively check the accuracy of their diagrams in Microsoft Visio. By running the validation process, users can detect any potential errors in their diagrams, such as missing or incorrect elements, broken links, incorrect references, and inconsistencies between objects. This makes it easier for users to quickly identify and address any potential issues in their diagrams, reducing the time spent troubleshooting and allowing users to create accurate diagrams more efficiently. Validation can be performed with just a few clicks and results are reported in real-time, making it an invaluable tool for those who need to quickly check the accuracy of their diagrams. For even greater reliability, users can also save the validation results for later review. With Microsoft Visio Diagram Validation, users can rest assured that their diagrams are accurate and up to date.
Microsoft Visio Collaboration and Publishing Features
Microsoft Visio is a powerful application that provides a wide range of features designed to facilitate collaboration, publication, and sharing of diagrams. Microsoft Visio's collaboration features allow users to easily share diagrams with colleagues, friends, or even entire teams. It enables users to co-edit diagrams in real-time allowing for more effective collaborative workflows. With the Visio Publishing feature, users can also publish diagrams online so that they are accessible to anyone with a web browser. This is especially useful for businesses or teams that need to securely share their diagrams with people outside of the company. Additionally, Visio enables users to save their work in multiple formats including PDF and image files, making it easier to share the diagrams in a variety of ways. Microsoft Visio is an excellent tool for not only creating diagrams but also for collaborating and sharing them with others effectively.
Microsoft Word Basic Skills

Microsoft Word is essential for any office worker, but basic skills are often taken for granted. Knowing how to set up a document and use formatting tools can save you time and effort when creating professional-looking documents. Microsoft Word basic skills also allow you to create documents that are easier to read, navigate, and share with others. With basic skills, you can create visually appealing and easily understood documents.
Learn the skills below in our Microsoft Word - Level 1 or Microsoft Word Combo courses:
Microsoft Word Interface Layout
The Microsoft Word interface layout consists of four main sections. The first is the Home tab, which contains familiar commands such as copy and paste, as well as formatting options for fonts, paragraph styles, and themes. The next section is the Insert tab which helps users easily insert objects such as images or tables into their documents. The third section is the Design tab, which allows users to customize page backgrounds and colors. Finally, the Page Layout tab contains options for setting margins, paper size, orientation, and spacing between paragraphs. With these four main sections of the interface layout, Microsoft Word provides users with an intuitive experience that allows them to quickly create attractive documents. Additionally, users can access helpful shortcuts within each section to make document creation even easier.
Microsoft Word has been designed to make the experience of creating documents more user-friendly and efficient. By offering an intuitive interface layout, users can easily access all the features they need to create professional-quality documents. The interface layout also allows users to customize their documents by taking advantage of various options for formatting, layout, and design. All this makes Microsoft Word a great choice for any word-processing task.
Microsoft Word Document Creation and Management Functions
Microsoft Word offers a comprehensive range of document creation and management functions that allow you to quickly and easily create professional-looking documents. Through the use of templates, you can easily customize your documents for any purpose, from letters and memos to web pages and presentations. You also have access to numerous formatting tools, enabling you to add visual elements such as bolding, italics, and font size changes. Furthermore, you can easily share documents with others through the use of mail merge and email tracking features. With Microsoft Word's advanced document management functions, you can quickly organize large document libraries and will be able to find what you are looking for in no time. Whether you need to collaborate on a project with colleagues in different locations or need to quickly share documents with customers and partners, Microsoft Word has you covered. With the power of Microsoft Office, you can have access to all of these features from any device, making document creation and management easier than ever before.
Microsoft Word Text Editing Functions
Microsoft Word text editing functions are essential tools for the modern business professional. There is a range of features available, from the simple clipboard and spellcheck capabilities to more complex functions such as formatting, creating tables, and inserting images. Each tool provides an easy way to create documents quickly and efficiently, allowing users to give their ideas the best possible presentation.
The clipboard is one of the most used Microsoft Word tools, and it allows users to quickly copy and paste items from other documents. Spellcheck is another useful tool that checks for errors in spelling and grammar, helping to ensure the accuracy of the text. For those who want more control over the look of their document, formatting options such as font size and color, justification, alignment, and line spacing can be used.
Creating tables is another of the Microsoft Word text editing functions that can help to organize information. This feature allows users to add rows and columns of data into a table format, making it easier to work with large amounts of information. Inserting images into documents is also possible, allowing users to add visuals and illustrations to their text.
Microsoft Word's text editing functions offer a range of options for business professionals, allowing them to quickly and efficiently create documents that are visually appealing and accurate. With the use of these features, users can easily give their ideas the best possible presentation.
Microsoft Word Text Formatting Features
Microsoft Word offers a variety of text formatting features that can be used to enhance the appearance and readability of your document. Commonly used formatting features include font size, font style, font color, line spacing, alignment, bullets, and numbering. Each of these features can be adjusted to create visually appealing documents that stand out from the rest.
Formatting text is easy to do and can help your document look polished and professional. You can use the formatting features in Word to change the font, size, color, line spacing, alignment, bullets, and numbering of any text in your documents. This allows you to make an individual section stand out on its own or match the style of the rest of the document.
With Word's formatting features, you can also apply different styles to your documents, such as bolded headings and subheadings, italicized words and phrases, or indented paragraphs. These tools make it quick and easy to create visually appealing documents that are sure to impress any reader.
Whether you are creating a professional presentation, a business report, or a personal letter, Microsoft Word's formatting features help you make your document look polished and organized. With its wide range of options, you can customize the look and feel of any document to fit your needs.
Microsoft Word Simple Graphic Functions
Microsoft Word is a powerful application that allows users to easily create and edit documents, notes, reports, and other text-based files. It also offers a wide range of simple graphic functions which can be used to enhance documents. These include inserting shapes, adding images or logos, adjusting page margins, and creating charts or tables. With these features, it's easy to visualize data, create eye-catching presentations and make documents look more professional. Microsoft Word also offers users a variety of formatting options to ensure that their document is laid out in the most efficient manner possible. This can be done by adjusting font size, color, and alignment as well as creating columns and bulleted lists. These simple graphic functions can help users create professional-looking documents quickly and easily. And, of course, all of these features are easy to use and don’t require any special technical knowledge. This makes them perfect for creating documents for both personal and business purposes.
With Microsoft Word's simple graphic functions, it's possible to make your document look as good as one created by a professional designer. Additionally, Microsoft Word also offers users the ability to save their files in various formats such as HTML and PDF, making it easy to share documents online or print them out for physical distribution. Whether you need to create a report for work or an invitation for an upcoming event, Microsoft Word's simple graphic functions make it easier than ever to create professional-looking documents.
Diagram Graphics in Microsoft Word
Diagram graphics in Microsoft Word are visual representations of data. They can be used to help communicate complex information quickly and effectively. With the use of diagram graphics, you can quickly summarize large amounts of data and create diagrams that are easy to understand. Microsoft Word offers a variety of pre-made templates for creating diagrams such as flowcharts, timelines, and organization charts. You can also create diagrams from scratch using shapes, text boxes, and other visuals. Diagrams are a great way to quickly communicate important information in an impactful and visually appealing way. By using diagram graphics in Microsoft Word, you can easily share key insights with others without needing to use any additional software or complicated formatting. It's also possible to customize and modify diagram graphics in Microsoft Word, making them a versatile tool for quickly conveying information.
Diagram graphics in Microsoft Word are an invaluable resource for any business or organization that needs to present data. Whether you're summarizing the results of market research or summarizing project timelines, diagram graphics can be used to quickly capture the key points and help your audience better understand complicated concepts. Diagram graphics in Microsoft Word can be a powerful tool for communicating information in an engaging and impactful way. By using them, you can easily convey even complex data clearly and concisely. With just a few clicks, diagram graphics can turn complex data into compelling visuals that are sure to capture the attention of your audience.
Microsoft Word Document Finalization and Sharing Functions
Microsoft Word offers a range of features to help users finalize and share documents. For example, the Track Changes feature allows users to keep track of revisions made by other contributors. This feature helps ensure that all changes are reviewed before being implemented in the document. It is also possible to compare two versions of a document side-by-side which can help ensure that all changes have been correctly implemented.
Once a document is finalized, Microsoft Word provides multiple options for sharing it with other users. Documents can be shared via email or saved to the cloud which allows multiple users to collaborate on a single document at once. Documents can also be printed directly from the program or exported as PDFs for easy sharing.
These functions make it easy for users to finalize and share documents created in Microsoft Word, allowing teams to quickly collaborate on projects from anywhere in the world. With these features, users can easily create, revise and share documents without the need for additional programs. The final product reflects their collaboration professionally.
Microsoft Word Interface Customization and Options Setup
Microsoft Word Interface customization and options setup are features that enable users to customize the look and feel of the Microsoft Word interface. This can be done through a variety of settings including changing the size, color, font, background image, and other elements. Additionally, users can configure their preferences for spell-checking, automatic saving frequency, file formats, and more. This customization capability allows users to create a unique experience tailored to their specific needs. It also ensures that they can always access the tools they need when they need them. With Microsoft Word customization and options configuration, users are provided with an array of options allowing them to customize their user experience and maximize productivity. This feature is a great way to make sure that Microsoft Word meets the needs of all users, ensuring they have an enjoyable and productive experience.
Microsoft Word Advanced Skills
Microsoft Word Advanced Skills are essential for business professionals in today's competitive job market. Creating and editing documents is a fundamental skill employers require in any field. Advanced Microsoft Word skills can also help you stand out from other job applicants, as they demonstrate a higher level of proficiency with the program. Advanced Microsoft Word skills include using tables and charts, working with multiple document windows, embedding files or objects into a document, and using the advanced features of Word such as SmartArt, mail merge, and document templates.
Learn the skills below in our Microsoft Word - Level 2 or Microsoft Word Combo courses:
Microsoft Word Columns and Tables
Microsoft Word columns and tables are two key features that can help you organize your documents. With columns, you can easily arrange text and graphics into multiple vertical sections of equal width. This makes it easy to display or compare data in a document. Tables enable you to add rows and columns of information in an organized manner, allowing for quick calculations and sorting. With both of these features, you can create complex documents that are easy to read and understand. Additionally, Microsoft Word provides several formatting options for tables and columns that allow you to customize the look and feel of your document. This makes it easy to create professional documents with precise formatting. By taking advantage of the features offered by Microsoft Word, you can create well-structured documents that are easy to read and understand.
Microsoft Word Charts
Microsoft Word charts, also known as graphs and diagrams, are a way to visually represent data. By creating a chart in Microsoft Word, users can quickly view relationships between different pieces of information they have entered into the program. Charts can be used to show patterns over time or compare the differences between two sets of numbers. They can also be useful when trying to explain a complex concept quickly and clearly. Microsoft Word provides several chart types, such as line graphs, pie charts, and bar graphs. Each chart type is customizable and users can decide which colors, fonts, and other elements they want to include in their chart. Microsoft Word makes it easy to create custom charts that fit the needs of any project. With a few clicks, users can upload their data into Microsoft Word and create an easy-to-understand chart that expresses their ideas clearly. Charts are a great way to communicate information quickly and effectively. By creating charts in Microsoft Word, users can make sure their data is presented in the most effective manner possible.
Microsoft Word Visual Elements
Microsoft Word visual elements are a range of graphical elements that can be added to documents to enhance their look and feel. Such visual elements include shapes, diagrams, images, and symbols, which can add context and provide additional information or draw attention to a particular section of the document. They also help create an organized layout and allow readers to more quickly identify the main points within a document more. The use of visuals in Microsoft Word can be highly beneficial, as they can make documents more visually appealing and help to convey complex information in an easy-to-understand manner. Visual elements can also help draw readers’ attention to the most important parts of a document. As such, it is important to ensure that the visual elements used are appropriate, as they can make a significant difference to how a document is perceived. Microsoft Word provides users with the ability to add visual elements such as shapes, lines, and arrows that can be used to help enhance documents. These can be combined in different ways to create diagrams, tables, and other visuals that can help break up a document and make it easier to understand. Additionally, users can also add images, charts, and other visuals to help illustrate their points. Finally, Microsoft Word also allows users to add symbols such as arrows or stars that can be used to draw attention to particular parts of a document.
By using visual elements effectively in Microsoft Word documents, you can significantly improve the overall look and feel of your documents, as well as make them easier to understand. This can be an invaluable tool for both personal and professional use.
Microsoft Word Content Organizing Techniques
Microsoft Word offers a variety of content-organizing techniques to help you make sure your writing is clear, concise, and easy to read. Some of the techniques include using headings and subheadings, outlines, tables and charts, bullets, and numbered lists.
Headings and subheadings are an effective way to organize larger pieces of text. They help break up long sections and make it easier for readers to scan the content. Outlines are useful for organizing longer documents, such as reports or papers, by giving structure and organization. Tables and charts can be used to present data in a visual format that is easy to understand. Bullets and numbered lists are a great way to highlight key points and make them stand out.
Using these organizing techniques in your documents can help ensure that the content is organized and easy to understand. Word also offers a variety of formatting options, including fonts, spacing, margins, and alignment, which can further improve the readability of your documents. With a few simple steps, you can create clear and organized content that will be sure to impress your readers.
Microsoft Word Collaboration Features
Microsoft Word has a range of collaboration features that make it easier for teams to work together. Through Microsoft Teams, users can easily share documents with others and co-author in real-time. All changes are tracked so that everyone knows what has been added or removed from the document, and older versions can also be accessed if needed. Users can also use Microsoft Word’s ‘Share with People’ feature to quickly share documents with colleagues, even if they are not using the same version of Microsoft Office. This ensures that everyone is always working from the latest copy. Additionally, comments can be added throughout documents to make sure that feedback and ideas are discussed collaboratively. Finally, Word files can be shared easily through a variety of cloud storage services, such as OneDrive and Dropbox. This ensures that documents are accessible from anywhere - regardless of the device being used. With Microsoft Word’s extensive collaboration features, teams can work together efficiently to create high-quality documents quickly and easily.
Microsoft Word Content Reference and Source Features
Microsoft Word's content reference features provide convenience and utility for users of all levels of expertise. These features allow users to easily create and use references from a variety of sources.
For example, one of the most powerful reference features offered by Microsoft Word is its ability to integrate with Microsoft’s online research service, Bing. Bing provides comprehensive and authoritative search results from millions of sources across the web. Users can easily access these search results and create citations in a fraction of the time it would take to manually look up each source.
Microsoft Word also offers content reference features for users who prefer to use more traditional library resources for their research. The program includes an extensive collection of library resources, including scholarly articles, books, and other reference materials.
In addition to traditional research sources, Microsoft Word also supports the ability to insert citations from third-party websites. This feature allows users to easily add content from popular sites such as Wikipedia and StackOverflow. The content is then automatically formatted into a correctly-styled citation, allowing users to quickly create professional-looking documents with the click of a button.
Overall, Microsoft Word's content reference features provide an efficient and convenient way for users to access the latest research from a variety of sources. With these powerful tools at their disposal, users can easily create accurate and well-formatted citations for any type of document.
Microsoft Word Data Merging Features
Microsoft Word's data merging features are an incredibly powerful tool to help streamline document production. They allow users to create a template populated with information from a structured data source, such as an Excel spreadsheet or Access database. This enables users to quickly create personalized documents for multiple recipients, eliminating the need for manual entry. Data merging is especially useful for creating mass mailings, customized forms, and name tags. Word's data merging features are easy to use and can save users a considerable amount of time in document creation. With just a few clicks, users can create tailored documents that contain accurate information from the source. Data merging also ensures consistency across multiple documents as every user will be using the same information. This helps avoid errors due to manual data entry or typos.
Microsoft Word's data merging features are an invaluable resource for streamlining document production. They offer a simple and efficient way to create personalized documents while ensuring accuracy and consistency across multiple documents. With the time saved, users can focus on more important tasks, such as interpreting and analyzing the data. Ultimately, these features can help businesses become more efficient and cost-effective.
Microsoft Word Custom Document Elements
Microsoft Word custom document elements are features that you can use to make your documents look more professional and organized. These elements may include template styles, page layout settings, headers, footers, and images. With these features, you can easily customize the appearance of a document without any coding experience. You have complete control over how the document looks with custom document elements, allowing you to tailor the look and feel of your documents to perfectly match your company's branding. Custom document elements are a powerful tool that can help you create professional-looking documents quickly and efficiently. By using custom document element features, you can save time on formatting and styling while ensuring that each of your documents looks polished and professional.
Related Microsoft Office Posts:
How Much Do Microsoft Office Training Courses Cost?
Public instructor-led Microsoft Office course prices start at $310 per student. Group training discounts are available.
Self-Paced Microsoft Office eLearning courses cost $155 at the starting point per student. Group purchase discounts are available.
What Microsoft Office Skills Should I Learn?
A: If you are wondering what Microsoft Office skills are important to learn, we've written a Microsoft Office Skills and Learning Guide that maps out Microsoft Office skills that are key to master and which of our courses teaches each skill.
Read Our Microsoft Office Skills and Learning Guide
Microsoft Office Suite Training by Certstaffix Training
Certstaffix Training offers three dynamic approaches to mastering Microsoft Office skills through our comprehensive Microsoft Office class. Our Microsoft 365 classes can be taken live online with expert instructors guiding you. For those who prefer to learn at their own pace, we offer Microsoft online courses which allow for self-paced eLearning. If you have a group of students, we offer a opportunity for corporate groups who want in-person onsite trainings through our mobile Microsoft Office 365 training center, brought to your office. We accommodate Microsoft 365 courses for every learning style and experience level, making us the ideal choice for Microsoft courses for beginners. Through our Microsoft training classes, you'll gain the competence needed to effectively navigate the Microsoft Office suite. Our Microsoft Office suite training is designed to equip you with the tools and knowledge necessary for business success.
How Do I Get a Microsoft Office Certification?
A: To earn a Microsoft Office certification, you'll need to start by selecting the right certification for your needs, whether it's a single-application credential for Word or Excel or a broader Microsoft Office 365 certification. Then, prepare by studying practice exams, taking a well-designed training course, and getting plenty of hands-on experience with the tools you need to master. Once you pass the exam, you'll get a certificate for Microsoft Office that validates your skills.
More Information on How to Get a Microsoft Office Certification
What's the Best Way to Learn Microsoft Office?
A: The most effective way to learn Microsoft Office is to combine structured learning with consistent practice. Microsoft Office includes programs like Word, Excel, PowerPoint, Outlook, and Access, each with features that can improve productivity and organization. Building Microsoft Office proficiency can help you work more efficiently, communicate clearly, and adapt to a wide range of professional environments.
What Is Microsoft Office, and How Is it Used?
A: Microsoft Office is a suite of productivity software developed by Microsoft that includes programs like Word, Excel, PowerPoint, and Outlook. These tools help users create documents, manage data, give presentations, and handle communication tasks efficiently. Available as desktop software or through Microsoft 365, Office is widely used in business, education, and personal settings. Understanding what Microsoft Office is and how its programs work can help your workforce improve productivity and streamline daily tasks.
Why Invest in Employee Training for HR Professionals?
A: Investing in employee training for professionals in human resource management (HRM) can be as important as obtaining training for your general workforce. In some ways, it can be even more imperative, as a fully functional and competent HR department can facilitate productivity among your staff. HR professionals can benefit from taking a number of courses, such as those that teach them how to work with common office software like Microsoft Office or skills like customer service. Adequate training for HR professionals can aid them in better identifying and addressing the needs of your employees.
Why Take Microsoft Office Training Classes From Home?
A: Taking Microsoft Office courses online from home can be a convenient and easy solution to employee training needs when time, money, and space are limited in a physical work environment. These classes have the benefit of being tailored to different programs and skill levels, making it easy to choose which concepts you need to focus on. Choose live instruction and log into your course from anywhere, or opt for a class that's self-paced so you can complete it at your leisure. Either way, you'll get hands-on training that can help employees get the skills they need and even prepare for certification exams.
More Information on the Benefits of Taking Microsoft Office Training Classes From Home
How and Why Should I Get Microsoft-Certified?
A: In today's offices and work spaces, earning one or more Microsoft certifications can be essential for showcasing your skills, increasing your salary, and progressing in your career. The process of earning a certification, however, can vary depending on your existing knowledge of relevant software, your work experience, and the particular certification pathway. While each certification pathway can differ in duration, generally, employees may earn certifications within a few months. For some individuals, signing up for training courses can significantly reduce the amount of time that it takes to prepare for Microsoft's certification exams.
What Are Some Useful Microsoft Project Tips?
A: The sheer number of features and functions available in Microsoft Project can often intimidate someone who isn't fluent in the program. However, using certain tips can simply project management processes and streamline tasks. Using pen and paper to plan out your project, creating baselines, auto-scheduling tasks, and choosing the right View to assess your project's status can create an efficient and productive digital environment in which to work. To learn more tips and get the most out of MS Project, sign up for instructor-led Microsoft Project courses.
More Information on What Are Some Useful Microsoft Project Tips?
What is the best way to learn Microsoft Office?
A: There is no one-size-fits-all answer to this question, as the best way to learn Microsoft Office will vary depending on your level of experience and expertise. However, some general tips can help you get the most out of your learning experience.
If you are a beginner, it is important to start with the basics. There are many resources available online and in libraries that can help you get started with the basics of Microsoft Office. For many beginners, taking a formal Microsoft Office course is the best route, as it offers a structured learning format with set topics. Once you have a good understanding of the basics, you can move on to more advanced topics.
If you are already familiar with Microsoft Office but want to improve your skills, there are also many resources available to help you do this. You can find targeted and smaller online courses, tutorials, and tips from experts to help you make the most of your already existing Microsoft Office skills.
Whatever your level of experience, taking the time to learn Microsoft Office can be a valuable investment. With so many resources available, there is no excuse not to get started today!
What is a Microsoft Office course?
A: A Microsoft Office course is a type of educational training that covers the various aspects of using the Microsoft Office software suite. This type of coursework can help users learn how to use the different features and applications within Microsoft Office, as well as how to optimize their workflows by integrating the tools in the suite. Microsoft Office courses can be taken online or in person, and typically cover the following topics:
- Microsoft Word: Users learn how to create, format, and edit text documents using Microsoft Word.
- Microsoft Excel: Users learn how to create and work with spreadsheets in Microsoft Excel.
- Microsoft PowerPoint: Users learn how to create presentations and slideshows using Microsoft PowerPoint.
- Microsoft Outlook: Users learn how to manage their email, calendar, and contacts using Microsoft Outlook.
Microsoft Office courses can be beneficial for both beginners who are new to the software suite and experienced users who want to learn more about how to use the tools effectively. The courses can also be customized to fit the needs of any user, whether they are looking for a general overview of the software or more specific training on one particular application.
How can I improve my Microsoft Office skills?
A: If you're looking to improve your Microsoft Office skills, there are a few avenues you can explore. One option is to find online tutorials or courses that can help you learn the specific features and functions you're interested in. Another possibility is to seek out books or other resources that offer step-by-step instructions for using Microsoft Office applications. Finally, you could consider attending a formal Microsoft Office training class or workshop to get hands-on experience and guidance from an expert.
The route you choose depends on your experience level and learning preferences. Whichever route you choose, with a little effort you can soon be on your way to becoming a Microsoft Office pro!
What is the fastest way to learn Microsoft Office?
A: There is no single answer to this question as everyone learns at a different pace. However, some general tips can help you learn Microsoft Office quickly and effectively.
First, it is important to have a clear understanding of what you want to achieve with Microsoft Office. Whether you want to use it for work or personal purposes, it is important to set some goals so that you can focus on your learning.
Next, make use of all the resources available to you. Formal Microsoft Office classes are available online or in-person for groups by Certstaffix Training that start at 1 day in length. There are also many self-teaching methods such as tutorials and guides available online, as well as books and other materials. Utilize these resources to learn at your own pace and in a way that suits your learning style.
Finally, practice, practice, practice! The more you use Microsoft Office, the more comfortable and confident you will become using it. Do not be afraid to experiment and explore all the features and functions available; this is the best way to learn.
By following these tips, you can learn Microsoft Office quickly and effectively.
What are options for Microsoft Office training near me?
Are you looking to enhance your skills in Microsoft Office? Do you want to learn more about the various tools and features within this popular software suite? Look no further, as we have compiled a list of resources for Microsoft classes near me that will meet your training needs.
Finding the Right Training
When it comes to finding the right Microsoft training near me, there are a few factors to consider. First, you should think about what specific skills or tools you want to focus on. Are you interested in learning more about Excel functions or creating engaging presentations with PowerPoint? Once you have identified your training needs, it's time to research different options for in-person Microsoft Office training near me.
In-Person vs. Online Training
For some, attending a physical classroom setting for training may be the preferred method. Fortunately, there are many resources available for in person Microsoft Office training near me. These classes allow you to learn from an instructor face-to-face and interact with other students in real time.
On the other hand, online training options offer flexibility and convenience for those with busy schedules. Many online platforms offer Microsoft Office workshops near me that can be completed online either at your own pace or a public live schedule to register from. There 2 options for online training - 1.) Live Online and 2.) Self-paced.
Live Online
Live Online features a set date and time to attend like an in-person class. A live teacher leads the class with lecture and hands-on exercises to reinforce the lecture.
Self-Paced Online
Self-paced online is often called eLearning. You view recorded video lectures and often have hands-on assignments you can complete to reinforce the video lecture.
Microsoft 365 and Office 365 Training
As Microsoft continues to evolve its software offerings, it's important to stay up-to-date on the latest updates and features. This is where Microsoft 365 training near me and Office 365 training near me come into play. These courses are specifically tailored to teach users about the newest versions of Microsoft Office and how to effectively use them in your day-to-day tasks.
Classes for Microsoft Office Near Me
In addition to traditional classroom settings, there are many classes for Microsoft Office near me offered by local organizations and universities. These classes may vary in length and intensity, so be sure to research which option best fits your learning style and needs. Some classes may also offer certification upon completion, which can be a valuable addition to your resume.
Conclusion
In summary, there are plenty of resources available for MS Office course near me that will allow you to enhance your skills and become more proficient in using Microsoft Office. Whether you prefer in-person or online training, there is an option out there for you. Take the time to research and find the right training that will help you reach your professional goals.
Certstaffix Training offers 3 options to learn Microsoft Office training near me:
Reach out to us for more information, a quote or register on our website for a live online or self-paced class today!
What are options to learn Microsoft Office?
Microsoft Office is a suite of applications that are essential for any business, school, or individual. Many people use these applications on a daily basis but may not be utilizing all of their features and capabilities. That's why it's important to invest in training courses to become proficient in using Microsoft Office.
Benefits of Microsoft Office Training
There are several benefits to attending Microsoft Office training. The most obvious one is that you will become more efficient and productive in using the applications, which can greatly benefit your work or studies. By learning from a certified instructor, you will be able to fully understand the features and functions of each application, allowing you to use them to their full potential.
Types of Microsoft Office Training
There are various types of training for individuals and businesses alike. In-person training is a popular option, where participants attend classes physically and learn from an instructor in person. This type of training allows for hands-on experience and immediate feedback from the instructor. Live online instructor-led format is also very popular and is often the most available in your area. You attend a set date and time, like in-person, but you attend online from you location and interact with the instructor and other students live just like in person.
For those who prefer to learn at their own schedule, self-paced online Office classes are also available. These courses provide flexibility as they can be accessed anytime, anywhere. However, they may not offer the same level of interaction and practical experience as in-person or live online training.
Advanced Microsoft Office Training
While most individuals are familiar with the basics of using Microsoft Office, there is always room for improvement and learning advanced features. Advanced MS Office training teaches attendees how to use these applications at an expert level, allowing them to create professional and complex documents, spreadsheets, presentations, and more.
Microsoft Classes for Adults
Microsoft Office classes are not just for students or professionals. There are also courses specifically designed for adults who may want to learn how to use the applications for personal use. These classes can teach individuals how to organize their finances with Excel, create invitations and flyers with Publisher, or manage their schedule with Outlook.
Microsoft Office Classes in Person
For those who prefer a more traditional approach, in-person Microsoft Office training is available. These classes are led by certified instructors and offer hands-on experience with the applications. Participants can ask questions, receive immediate feedback, and network with other individuals attending the class.
Start Learning Office 365 Today
Investing in Microsoft Office training can greatly improve your proficiency and productivity in using these essential applications. Whether you prefer in-person classes or online courses, there are plenty of options available to suit your learning style. Don't miss out on the opportunity to enhance your skills and become an expert at using Microsoft Office.
It is always recommended to take up some sort of Microsoft training. With the availability of various types such as Microsoft in person training, Microsoft instructor led courses and online Office classes, it has never been more convenient to improve your skills.
Certstaffix Training offers live online, in person (corporate groups only) and self-paced Excel training formats. Sign up for a class today and take the first step towards becoming a Microsoft Office pro!
What are the top Microsoft Office skills?
A: To be proficient in Microsoft Office, there are certain skills you need to master. These skills include:
Top Microsoft Office Skills
1. Knowing how to use the various features in each of the programs.
2. Being able to create and edit documents, spreadsheets, and presentations.
3. Knowing how to manage files and folders.
4. Being able to collaborate with others using the various tools available.
5. Having a good understanding of how to troubleshoot problems that may occur.
6. Knowing how to customize the various settings to better suit your needs.
7. being able to use the different keyboard shortcuts available in each program.
8. Knowing how to use the various templates that are available.
9. Being able to create macros to automate tasks.
10. Knowing how to use the different add-ins that are available for the various programs.
These are just some of the skills that you need to master to be proficient in Microsoft Office. By taking the time to learn these skills, you will be able to use the programs to their full potential and get the most out of them.
Where Can I Learn More About Microsoft Office?
Immerse yourself in the world of efficiency with our comprehensive Microsoft 0365 training at Certstaffix Training! We provide a trio of Microsoft online lessons to elevate your Microsoft Office skills: Live Microsoft training course hosted on the internet, self-driven Office 365 course that you can undertake at your convenience, and personalized Microsoft courses near me specially designed for corporate teams at their office. We extend our expertise with Microsoft training online and our exclusive Microsoft Office suite courses. Achieve a certificate in MS Office and take a step ahead in your professional journey. Start your journey and learn Microsoft Office suite with us today!
Microsoft Office Blogs
Microsoft Office User Groups
Microsoft Office Online Forums
Software Training
Courses by Location
- Project Management Certification DC
- PMP Training Miami
- Python Programming Course NYC
- Cyber Security Programs Colorado
- Cyber Security Certifications San Antonio
- Computer Coding Classes Atlanta
- Cyber Security Program San Diego
- Project Management Certification New York
- QuickBooks Training Houston
- Cyber Security Programs Maryland